Rising Productivity, Declining Population Impact Russia's Economy
The Berlin Wall collapsed in 1989, and the Soviet Union did so two years later. Since then, Russia's transition to a market-based economy and a Western-style democracy has been slow. Yet, in recent years, Russia has been playing an increasing role on the international scene. But where exactly does the Russian economy stand relative to that of the United States? And how has this standing evolved over time? In this article, I present a few aggregate statistics to help answer these questions.
The Growth Rate of GDP per Capita
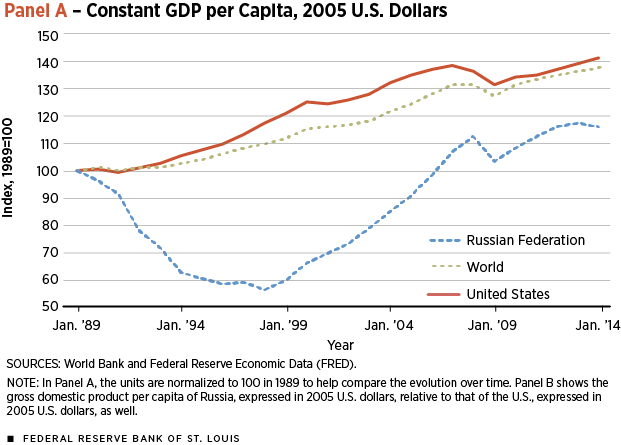
Let's start with the most basic aggregate indicator of the state of an economy: the real gross domestic product (GDP) per capita. This is a measure of the amount of final goods and services to which the average person has access in a given period of time. Panel A of Figure 1 shows GDP per capita over time in the Russian Federation, the U.S. and the whole world. The figures are normalized to 100 in 1989. Thus, Panel A indicates differences in the growth rate of GDP per capita in Russia, the U.S. and the world as a whole.
Notice three subperiods in particular. The first one, lasting from 1989 to 1998, shows a remarkable decline in Russia's GDP per capita. At the trough, in 1998, Russia's real GDP per capita was 56 percent of its 1989 value. In annual terms, this amounts to a 5.6 percent reduction in GDP per capita every year for 10 years. In comparison, when the U.S. GDP per capita declined during the Great Recession, which ran from the end of 2007 until mid-2009, it did so by just 4 percent. Over the entire 1989-1998 period, GDP per capita in the U.S. actually rose 17 percent. (World GDP per capita rose 10 percent over those 10 years.)
The second subperiod of note in Panel A runs from 1998 to about 2008. During this time, Russia's GDP per capita was on the rise. In 2007, it exceeded its 1989 level for the first time—GDP per capita was 7 percent above what it was in 1989. In contrast, U.S. GDP per capita in 2007 was 39 percent above its 1989 level.
Finally, since 2008, Russia has suffered the consequences of the Great Recession, and its GDP per capita has not exhibited much growth relative to the preceding years. It is too early to assess whether this pause is going to last a long or short time.
The Level of GDP per Capita
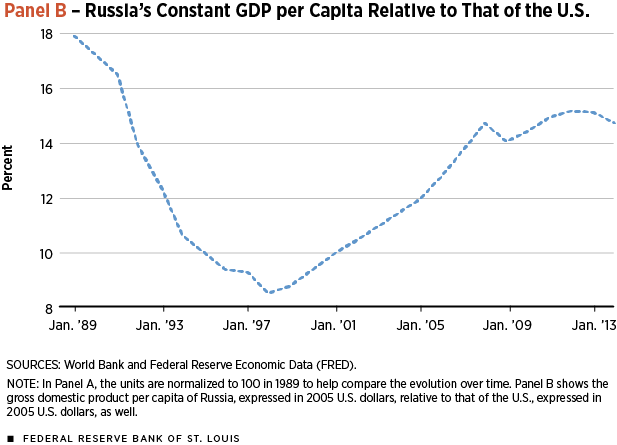
Panel B of Figure 1 shows Russia's GDP per capita relative to that of the U.S. In 1989, Russia was already poor relative to the U.S. Russia's GDP per capita was about 18 percent of that of the U.S. The deep recession following the collapse of the Soviet Union (noted in Figure 1) made things even worse. At the trough in 1998, Russia's GDP per capita was less than 9 percent of that of the U.S.
After 1998, Russia started to grow faster than the U.S. Despite the progress made in closing the gap between 1998 and 2008, Russia still had not reached by 2008 its 1989 level relative to the United States. The federation remains a noticeably poorer economy, with a GDP per capita in the neighborhood of 15 percent of that of the U.S.
The Role of Productivity
Economists Revold Entov and Oleg Lugovoy have presented an interesting study of the behavior of Russia's GDP during this period. They used a technique called growth accounting, which decomposes the growth of GDP into the contribution of the growth of the factors used to produce it: capital, labor and productivity. They showed that Russia's negative growth during the 1989-1998 period resulted from lower productivity, employment growth and capital utilization. Each of these components, they found, contributed equally to the negative growth rate.
For the next 10 years, however, the growth rate in Russia was stronger than that in the United States. Productivity growth was the main reason, accounting for 59 percent of the GDP growth. The contributions of capital and labor were smaller, 28 and 13 percent, respectively.
To understand the reason behind productivity growth in the 1998-2008 period is beyond the scope of this article. There exists a vast literature on the Russian transition and the effects of reforms undertaken since the fall of the Berlin Wall. A few works are listed in the references.
The Population
To assess the performance of an economy via GDP per capita alone raises many well-known issues. In particular, an increase in GDP per capita does not necessarily imply an increase in the well-being of the population.1 For this reason, economists sometimes rely on alternative measures of performance, such as measurements of people's heights and life expectancy. In the case of Russia, it is instructive to look at the evolution of its population in terms of life expectancy, birth rates and net migration.
This is not to say that a country's population is a direct measure of well-being. The assumption behind the analysis is rather that the two are positively correlated: When a population's well-being increases, life expectancy may increase as well (because of improvements in health, for example). In addition people are more willing to enter the country and less willing to leave it. All these factors contribute to increasing the country's population.
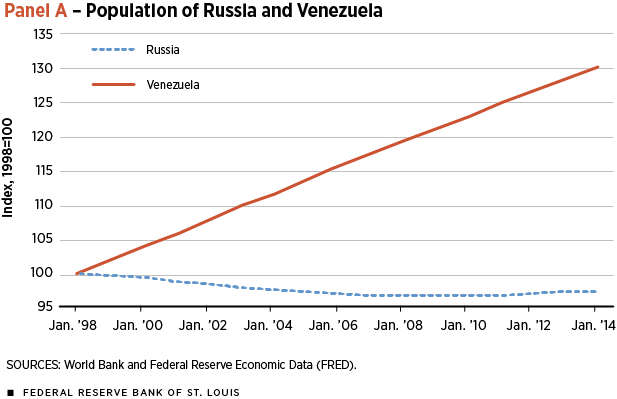
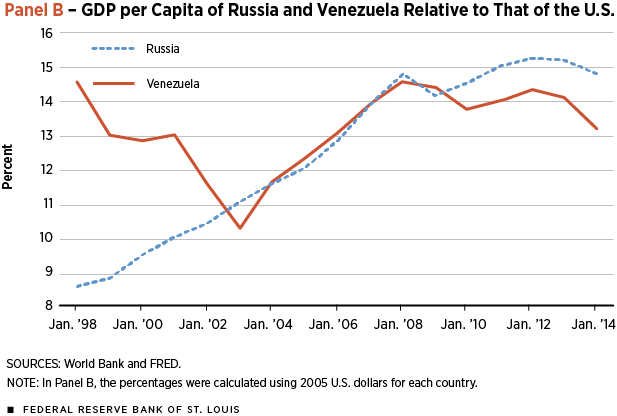
Panel A of Figure 2 compares the evolution of Russia's population since 1998 with Venezuela's. The figures are normalized to 100 in 1998 to render the comparison possible. Why compare Russia with Venezuela? Because for many of these years, the two countries had levels of GDP per capita (relative to the United States) that were similar. This similarity can be seen in Panel B of Figure 2.2
The message to take away from Figure 2 is that Russia was adversely affected by factors other than GDP per capita that resulted in a 3 percent decline of its population between 1998 and 2014. During the same time, Venezuela's population grew by 30 percent.
Understanding the causes of this demographic slump raises interesting and challenging questions. Answering them is, again, beyond the scope of this article.
Conclusion
Russia has a long way to catch up to levels of GDP per capita in the U.S. Data suggest that this catching up is taking place, thanks to productivity growth, even though the catching up may have been put on a temporary hold after the Great Recession. But a deeper problem faces Russia: Why is its population shrinking? Will this phenomenon last, or will population rise again?
Endnotes
- Think, for example, of wars that are accompanied by increased government spending, which, mechanically, raises GDP per capita. [back to text]
- There is a noticeable difference for the first four years, but this only reinforces the point being made here: The Venezuelan population grew during these four years, despite the bad performance of its GDP per capita. [back to text]
References
Entov, Revold M.; and Lugovoy, Oleg V. "Growth Trends in Russia after 1998," Chap. 6 in Michael V. Alexeev and Shlomo Weber, eds., The Oxford Handbook of the Russian Economy. Oxford, UK: Oxford University Press, 2013.
Shliefer, Andrei; and Treisman, Daniel. "A Normal Country: Russia after Communism." Journal of Economic Perspectives, Winter 2005, Vol. 19, No. 1, pp. 151-74.
Solanko, Laura. "Essays on Russia's Economic Transition," Scientific Monographs, 2006, 36, pp. 1-133.
Views expressed in Regional Economist are not necessarily those of the St. Louis Fed or Federal Reserve System.
For the latest insights from our economists and other St. Louis Fed experts, visit On the Economy and subscribe.
Email Us


