Focus on Low Real Interest Rate Might Be Misplaced
Yields on government securities issued by the U.S. Treasury Department have been falling steadily since the end of the Great Inflation in the early 1980s. In nominal terms (not adjusted for inflation), interest rates on 10-year Treasury bonds have been below 3 percent since July 2011. Over the same period, the yield on Treasury Inflation Protected Securities—also known as the real interest rate (that is, adjusting for inflation)—has been below 1 percent. This extended period of low real interest rates has been a surprise to forecasters. Currently, the consensus of professional forecasters is that long-term real interest rates will remain quite low through the end of 2016.
Fundamentally, real interest rates are determined by the levels of saving and fixed investment in the economy. All else equal, a decrease in the real interest rate occurs if saving increases or fixed investment decreases; an increase in the real interest rate occurs if saving decreases or fixed investment increases. Some have argued that low real interest rates mostly reflect a decrease in fixed investment—chiefly, the lack of productive investment opportunities in the economy. Proponents of this view have termed this the "secular stagnation" hypothesis. However, others argue that low real interest rates are caused by an increase in global saving, which is often termed the global savings glut. Still others argue that low yields on government bonds are not an accurate measure of the real rate of return on investment. This article will examine these competing explanations for low real interest rates.
A Bit of Background
The steady decline in nominal and real interest rates is a global phenomenon, experienced by both advanced economies and emerging market economies. Since the 1980s, the world long-term real interest rate has declined from about 4 percent to nearly zero.1 This development suggests that there might be a common factor that explains similar movements across most countries.
Falling inflation rates, which have lowered inflation expectations, are a key reason why nominal long-term interest rates have declined steadily over the past three decades. However, nominal interest rates also include a real return—the real interest rate—and real rates, as noted above, are affected to a significant extent by the supply of savings and demand for fixed investment goods financed by that saving. The supply and demand for savings are influenced by many things, including overall business conditions, government budget deficits, households’ propensities to save, and decisions by the government and the private sector to increase expenditures on capital goods (roads, bridges, buildings, equipment, etc.).
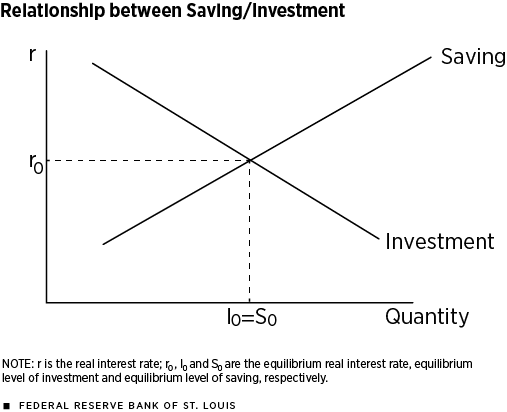
The economic relationship between saving and investment and the determination of the real interest rate is shown in Figure 1. For now, we will assume that saving and investment depend solely on the behavior of firms and households—that is, we are ignoring the role of government and international financial capital flows. Firms will invest up to the point where the return to investment from the last dollar invested equals the cost of financing for that dollar. In similar fashion, households save up to the point where the return on the last dollar saved just compensates them for the consumption lost by saving that dollar. The equilibrium real interest rate thus occurs where saving exactly finances investment.2
The real interest rate also affects other economic variables that affect spending and, thus, the pace of economic activity, such as exchange rates and stock prices. Accordingly, economists and policymakers usually focus on the real interest rate rather than the nominal interest rate when discussing future changes in economic activity.
Competing Hypotheses
Two explanations have been put forth to help explain the key reasons for the decline in the real interest rate. The first explanation focuses on the aforementioned secular stagnation, an old hypothesis that was recently resurrected by Harvard professor Lawrence Summers.3 The second explanation, which is somewhat related, though with very different implications, focuses on an increase in global saving—the aforementioned global savings glut. Former Federal Reserve Chairman Ben Bernanke is most closely associated with this hypothesis.4
Although there are other explanations put forth to explain the decline in real interest rates over time, these two appear to dominate the discussion. Interested readers seeking other explanations are referred to a recent report by the Council of Economic Advisers.5
The Global Savings Glut Hypothesis
This hypothesis has its genesis in the immediate aftermath of the 1998 Asian financial crisis. In 2005, Bernanke argued that low real interest rates were the result of several global factors. One key factor was that fast-growing emerging-market economies began to run current account surpluses to help them better support their currencies in the event of future financial storms. In a national income accounting sense, moving from current account deficits to surpluses amounts to an increase in national saving. For example, China’s household saving rate rose from about 31 percent in 1998 to a little more than 42 percent in 2010.
Although China’s capital controls limit the flow of domestic saving to other countries, increased saving from other emerging market economies—whether in Asia, South America or Eastern Europe—has flowed to advanced economies like that of the United States. In this case, argued Bernanke, U.S. assets offered higher risk-adjusted returns than did domestic assets. The increased global saving from emerging markets that flowed into the United States increased the amount of saving available for U.S. investment. In Figure 1, then, the saving schedule includes saving by both domestic and foreign residents. Thus, an increase in foreign saving flowing into the United States would increase U.S. saving and would be reflected by a rightward shift in the saving schedule. All else equal, this would lower the U.S. real interest rate. Lower rates would lower the cost to firms for investment, making them more willing to take on projects with much lower returns. Therefore, the net result of a foreign saving influx would be an increase in investment.
The Secular Stagnation Hypothesis
This hypothesis originated with an idea advanced by economist Alvin Hansen in 1938.6 At its core, the modern version of the secular stagnation argument is that weak aggregate demand—as exhibited by weak real gross domestic product (GDP) growth—and a paucity of investment opportunities at the prevailing real interest rate have led to a decline in the demand for capital. The decline in the demand for capital can reflect a decrease in the productivity of capital, an increase in business uncertainty about the economy’s long-term growth or future taxes, or reductions in infrastructure spending by federal, state and local governments.7 A decline in the demand for capital means that firms are willing to invest less at a given interest rate. In our simple model of the determination of the equilibrium real interest rate in Figure 1, this results in a leftward shift of the investment demand schedule. Thus, if the secular stagnation hypothesis is correct, our model predicts that the real interest rate will decline and investment will decrease.
Examining the Evidence
Although both hypotheses predict that recent events are consistent with the recent decline in the real rate of interest, the hypotheses give very different predictions about fixed investment. The secular stagnation hypothesis argues that the lower rate reflects a decrease in the demand for capital investment, owing to weaker economic growth among other factors. However, the global savings glut hypothesis is that there has been a rightward shift in the saving schedule, which, as seen in Figure 1, lowers the real interest rate and increases investment. Thus, to determine which hypothesis is more consistent with the facts, we will now look at the data on saving and investment and the returns to capital.
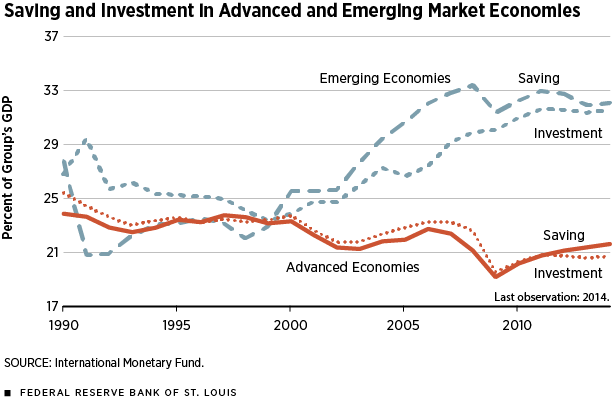
Figure 2 plots saving and investment in advanced economies (AEs) and emerging- market economies (EMEs) as a percentage of each group’s GDP. In this case, total saving is the sum of saving by (i) households, (ii) businesses and (iii) governments.8 The data are annual and collected by the International Monetary Fund. Beginning in the late 1990s, EMEs began to increase their saving, as noted above, and this excess saving was flowing to advanced economies, especially to the United States.9 In more recent years, though, the EMEs have begun to save less while the AEs have saved more. Although not directly visible in Figure 2, total global saving in 2014 was nearly 26 percent of global GDP, its highest level in decades.
But what about U.S. investment? An examination of U.S. investment shows that there appears to be a significant amount of profitable private investment opportunities in business equipment and intellectual property.10 However, owing to the recent boom and bust in housing and commercial real estate, net fixed investment in residential and business structures remains relatively low.11 On balance, the evidence on the saving and investment data the past few years seems to give the edge to the global savings glut hypothesis.
Recall that a key aspect of the secular stagnation hypothesis is that the rate of return on investment—such as a Boeing 767 purchased by an airline, or an office building constructed by a Fortune 500 company—has diminished in recent years. But the rate of return on capital is very different from the real interest rate on a 10-year Treasury security. Thus, if the secular stagnation hypothesis is correct, we should expect to see low rates of return on capital. Finding these rates for the world is difficult to do, but some researchers at the Federal Reserve Bank of St. Louis have done these calculations for the United States.
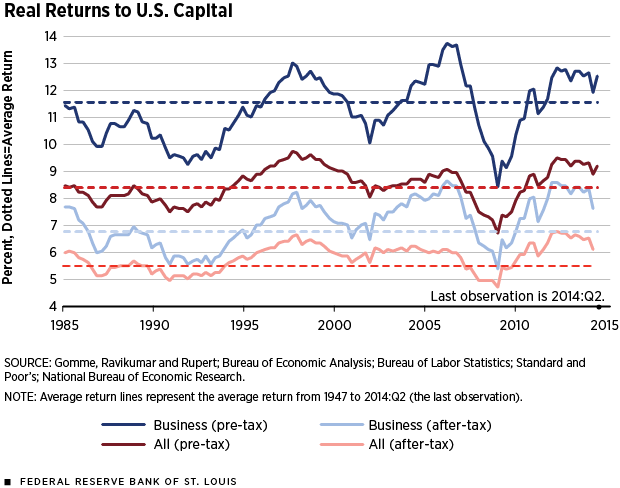
Figure 3 shows four measures of the real rate of return to capital. The first two rates measure the before- and after-tax real return on business capital (equipment, software and structures).12 The second set of measures shows the before- and after-tax return on all private capital (nonresidential business plus residential).
There are a few takeaways from the chart. First, the returns on business capital are higher than residential capital. Second, returns are volatile and tend to rise and fall with the business cycle. Third, and most important, there has been no secular decline in the rate of return on capital—either before- or after-tax. This last piece of evidence suggests that there has been no decline in the productivity of capital, which conflicts with a key tenet of the secular stagnation hypothesis. Thus, analysts should not look at real returns on financial assets (government bonds) as a proxy for the real return on capital. That said, it remains a bit of a puzzle why real returns to government bonds have fallen but real returns to productive capital have not.
Conclusion
U.S. and global real returns on safe, liquid government debt have fallen substantially over the past 25 years or so. Some have argued that real yields have been depressed by a global savings glut (an excess of saving relative to profitable investment opportunities), while others have pointed to the exact opposite—a lack of profitable investment opportunities that has reduced the demand for fixed investment. On balance, the evidence modestly supports the global savings glut story. However, this debate misses the larger and more important point: What matters for long-term growth is the real return to capital. And on that score, real returns to productive U.S. fixed investment in tangible capital have not fallen over the past 25 years.
Undoubtedly, there are some valid reasons why the economy has experienced slow growth during this expansion, but a sharp decline in the rate of return to capital does not appear to be one of them.
Endnotes
- See Bank for International Settlements and Haldane for further discussion of the world real interest rate decline. As a note, the world real interest rate cited in Haldane is the average 10-year yield of inflation-indexed bonds in the G-7 countries (excluding Italy). [back to text]
- In practice, shifts in the saving or investment schedule are continuous and reflect the decisions of millions of individuals and businesses on a daily basis. [back to text]
- See Summers. [back to text]
- See Bernanke. [back to text]
- See Council of Economic Advisers. [back to text]
- See Hansen for the original discussion of secular stagnation, and see Rachel and Smith for a brief history of the secular stagnation argument. [back to text]
- Summers has also argued that there has been a decrease in debt finance, reflecting the changing nature of U.S. industry. For example, the rise of technology companies relative to large manufacturers reduces the economy’s capital intensity. [back to text]
- For a closed economy (an economy with no foreign trade or cross-country financial capital flows), domestic saving must equal domestic investment. However, in an open (i.e., global) economy with trade and capital flows, if a country’s saving is not large enough to finance its domestic investment, then it can import foreign saving to make up the difference. However, because total saving must equal total investment for the global economy, this means that saving must exceed investment for some countries. [back to text]
- John Taylor argued in his 2009 book that there was a positive saving gap outside the United States from 2002 to 2004, but this was offset by an equally large negative saving gap by the United States. This development, he argues, should have had no additional effect on the world interest rate. [back to text]
- In 2014, real net fixed investment in equipment and intellectual property as a share of real net domestic product was appreciably higher than its average over the period from 1983 to 2013. [back to text]
- Net fixed investment measures the change in the capital stock, net of depreciation (capital consumption). [back to text]
- These returns are calculated by Paul Gomme, B. Ravikumar and Peter Rupert, and are discussed in their 2015 Economic Synopses article. The returns are derived from national income and product account data, and they net out depreciation and payments to labor. [back to text]
References
Bank for International Settlements. 85th Annual Report. June 19, 2015.
See www.bis.org/publ/arpdf/ar2015_ec.pdf.
Bernanke, Ben S. "The Global Saving Glut and the U.S. Current Account Deficit." Speech presented at the Federal Reserve Bank of St. Louis Homer Jones Lecture, April 14, 2005. See www.federalreserve.gov/boarddocs/speeches/2005/20050414/default.htm.
Council of Economic Advisers. "Long-Term Interest Rates: A Survey." Executive Office of the President of the United States, July 2015. See www.whitehouse.gov/sites/default/files/docs/interest_rate_report_final_v2.pdf.
Gomme, Paul; Ravikumar, B.; and Rupert, Peter. "Secular Stagnation and Returns on Capital." Federal Reserve Bank of St. Louis Economic Synopses, 2015, No. 19. See https://research.stlouisfed.org/publications/economic-synopses/2015/08/18/secular-stagnation-and-returns-on-capital.
Haldane, Andrew G. "How Low Can You Go?" Speech presented at the Portadown Chamber of Commerce, Portadown, Northern Ireland, United Kingdom, Sept. 18, 2015. See www.bankofengland.co.uk/publications/Documents/speeches/2015/speech840.pdf.
Hansen, Alvin H. Full Recovery or Stagnation. New York, N.Y.: W.W. Norton, 1938.
Rachel, Lukasz; and Smith, Thomas D. "Secular Drivers of the Global Real Interest Rate." Staff Working Paper No. 571, Bank of England, December 2015. See www.bankofengland.co.uk/research/Documents/workingpapers/2015/swp571.pdf.
Summers, Lawrence H. "U.S. Economic Prospects: Secular Stagnation, Hysteresis, and the Zero Lower Bound." Business Economics, 2014, Vol. 49, No. 2, pp. 65-73. See www.palgrave-journals.com/be/journal/v49/n2/pdf/be201413a.pdf.
Taylor, John B. Getting Off Track: How Government Actions and Interventions Caused, Prolonged, and Worsened the Financial Crisis. Stanford, Calif.: Hoover Institution Press, 2009.
Views expressed in Regional Economist are not necessarily those of the St. Louis Fed or Federal Reserve System.
For the latest insights from our economists and other St. Louis Fed experts, visit On the Economy and subscribe.
Email Us


