


District's Patterns in Imports and Exports Sometimes Differ from Nation's
In the United States, the distribution of economic activity varies across the country. Different U.S. states tend to specialize in the production of some goods and services more than other states do. For this article, we compared trade activity in the states that make up the St. Louis Fed’s District with trade activity at the national level. Understanding the regional characteristics of production and trade is important in order to gauge, for example, the effects of an increase in Chinese imports on local labor markets or the effects of a European recession on the auto industry. Our analysis here is descriptive but can be seen as a step toward understanding the effects of globalization on the District.
In broad terms, the average state in the District was slightly less active than the U.S. in terms of trade. In 2014, the U.S. imported $7,362 and exported $5,082 of goods per capita; the average state in the District imported $7,023 and exported $4,348 of goods per capita. The distribution varied widely across the states, though, and Illinois and Tennessee imported more than $10,000 per capita—far more than the national average.
We used import and export data from the Census Bureau’s Foreign Trade Statistics at the national and state levels for 2014.1 We classified the goods according to the three-digit North American Industry Classification System (NAICS) and focused on the five largest export and import categories for the United States and on the top four trading partners for both the U.S. and District, namely Canada, Mexico, the European Union (EU) and China.2
Trade by Major Partner
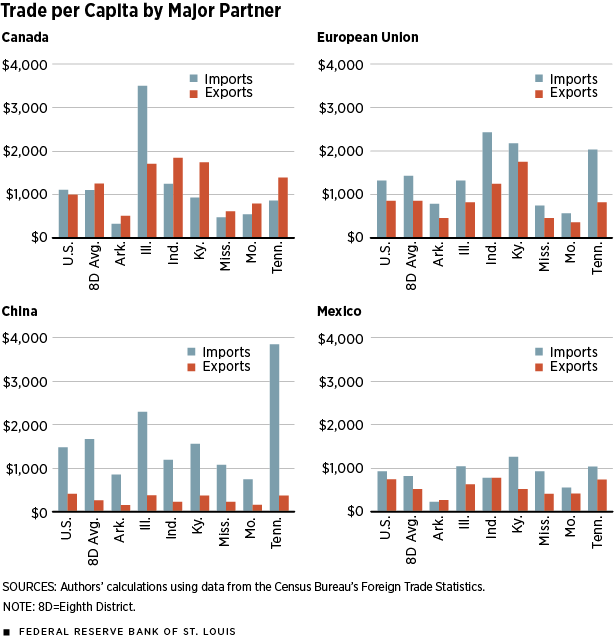
Similar to the U.S., the average District state imported more from China than from the other three areas and exported more to Canada than to the other three. In all District states, imports from China exceeded exports to China. Tennessee imported the most from China in 2014, with $3,868 of goods per capita, which is more than twice the amount of U.S. imports from China per capita that year. Illinois imported almost the same amount from Canada in 2014, at $3,529 per capita. Illinois, Indiana and Kentucky all exported substantially more to Canada per capita than the U.S. did in 2014.
On average, trade with the European Union in the District was similar to that of the nation, but a few District states traded heavily with the EU. Indiana, Kentucky and Tennessee imported more than $2,000 per capita from the EU in 2014. Kentucky also exported quite a bit to the EU, at $1,752 per capita in 2014.
Trade with Mexico was more evenly distributed across the District states. On average, the District imported $822 per capita from Mexico and exported $524 per capita to Mexico in 2014. Kentucky imported the most from Mexico, at $1,246 per capita, exceeding the national average of $922. Indiana exported the most to Mexico at $761 per capita in 2014, only slightly more than the U.S. at $753.
Trade by Major Commodity
A well-known fact in international economics is that a large portion of trade across countries involves similar types of goods. This is sometimes referred to as intra-industry trade.3 The table breaks down imports and exports in the District’s states by major trading commodity and reveals that, in most cases, a large volume of imports and exports occurred across the same industries.
Similar to the U.S., the largest import category in the District was computer and electronic products. On average, each District state imported $1,160 per capita of computer and electronic products in 2014. The U.S. imported slightly less, at $1,147. Tennessee was the largest importer of these products in the District, which is consistent with the state’s large amount of imports from China. In contrast, the District exported less in computer and electronic products than the nation did, averaging $374 per capita in 2014 compared with $656 for the nation. This may reflect the fact that the computer and electronics industry is not as important in the District, in terms of value added or economic activity, as in the nation.4
Transportation equipment was the second-largest import commodity for both the District and nation, at over $1,000 per capita in 2014 for both regions. Kentucky was the largest importer of transportation equipment in 2014, at $1,950 per capita. In terms of exports, the District and the nation exported more transportation equipment than other commodities in this group. In 2014, the District exported $1,139 per capita on average of transportation equipment; the U.S. exported $858 per capita. The largest exporter of transportation equipment was Kentucky, at $3,118 per capita. Indiana and Tennessee also exported a large amount. The states that traded the most in transportation equipment were also the states with a large share of value added in transportation equipment. Indiana, Kentucky and Tennessee all had a larger share of value added in transportation equipment than did the District and nation.
Imports and exports of chemicals and machinery in the District were broadly similar to national patterns. Indiana imported more than $2,000 per capita of chemicals in 2014, and Kentucky and Illinois imported more than $900 per capita of nonelectrical machinery. The average District state exported $672 per capita in chemicals and $437 per capita in nonelectrical machinery. These numbers were similar to the U.S. export numbers, at $628 per capita and $478 per capita, respectively.
The notable difference between District and national imports was in the category of petroleum and coal products. The U.S. imported about $257 per capita in petroleum and coal in 2014, while the District, on average, imported only $37 per capita. Among the District’s states, Mississippi imported the most, at $165 per capita, while imports in Tennessee were essentially nonexistent.
Conclusions
The District states’ imports and exports in 2014 were mostly similar to those of the nation. Kentucky, Indiana, Tennessee and Illinois traded the most, while Missouri, Mississippi and Arkansas were not very active in terms of imports and exports. The most-traded commodities in the District states came from industries with a large share of value added, with the exception of computers and electronics. This implies that, for the most part, the patterns of international trade were linked to industries with a high level of economic activity in the District.
Endnotes
- Due to data limitations, our analysis considered data for each state in the District in its entirety even though portions of six of the seven states in the District actually lie in a neighboring Fed district. [back to text]
- When the EU is considered as one trading partner, trade between the U.S. and the EU exceeds U.S.-Japan trade. When individual countries are considered, Japan is a larger trading partner than any individual European country. [back to text]
- The early works of Grubel and Lloyd and of Greenaway and Milner analyze the empirical patterns of trade across countries and find that most trade is intra-industry. [back to text]
- An industry’s value added, or gross product, is calculated as incomes earned by labor and capital plus the expenses incurred during production. For example, wages, salaries, profits earned by business owners, and taxes that count as business expenses are all included in an industry’s value added. [back to text]
References
Greenaway, David; and Milner, Chris. “On the Measurement of Intra-Industry Trade.”
The Economic Journal, December 1983, Vol. 93, No. 372, pp. 900-08.
Grubel, Herbert G.; and Lloyd, Peter J. Intra-Industry Trade: The Theory and Measurement of International Trade in Differentiated Products. New York: Wiley, 1975.


Views expressed in Regional Economist are not necessarily those of the St. Louis Fed or Federal Reserve System.
For the latest insights from our economists and other St. Louis Fed experts, visit On the Economy and subscribe.
Email Us