Despite Crosscurrents, Economy Is Showing Signs of Strength
In 2015, the global economy was projected to have grown at its slowest pace since the financial crisis in 2009. Slowing global growth over the past several years reflected slow or slowing growth in China, Japan, Europe and several emerging market economies. In response, prices for key commodities, such as crude oil and copper, have fallen sharply. Of course, the decline in crude oil prices also reflects the step-up in global production in key oil-producing countries, including Saudi Arabia and the United States, where the fracking revolution increased domestic production by nearly 80 percent from mid-2011 to early 2015.
Sluggish economic conditions spurred several of the world's major central banks to enact expansionary monetary policies. For example, in early December 2015, the European Central Bank extended its asset purchase program for an additional six months and reduced its deposit rate to –0.3 percent from –0.2 percent.
What's in Store for the U.S.?
Compared with most other advanced economies, the U.S. economy has registered steady, albeit modest, growth since the recession ended in June 2009. This moderate growth has been accompanied by low inflation, low interest rates and a steadily falling unemployment rate. But perhaps more important, after seven years of a near-zero policy rate and three rounds of quantitative easing, the Federal Open Market Committee (FOMC) voted Dec. 16 to raise its intended federal funds target rate by 25 basis points. This was the first increase since late June 2006. The relatively stronger growth in the United States, coupled with a modest divergence in monetary policies, has contributed to a sharp appreciation of the value of the dollar.
For most of the past year, much of the U.S. economy's strength was concentrated in consumer spending and housing activity. In 2015, auto sales were the strongest on record, and housing starts were on pace to be the strongest since 2007. However, some of the key October data were softer than expected. This development, coupled with a relatively large increase in household saving in October and a modest erosion in consumer confidence in November, suggests that consumers may have been a bit skittish heading into the final months of 2015. That said, surveys of retailers and consumers showed that household spending during the holiday season was expected to be significantly larger than a year earlier.
Among the pockets of weakness in the U.S. economy are those in the nonautomotive manufacturing sector and, more generally, in export-intensive industries. The sluggish pace of activity in parts of the industrial sector reflects falling oil prices, which have caused a sharp pullback in drilling activity, a stronger dollar and economic weakness in several key export markets. In addition, as highlighted in recent issues of the St. Louis Fed's Agricultural Finance Monitor, farmers are postponing equipment purchases and other capital expenditures in response to a second consecutive year of declining real net farm income.
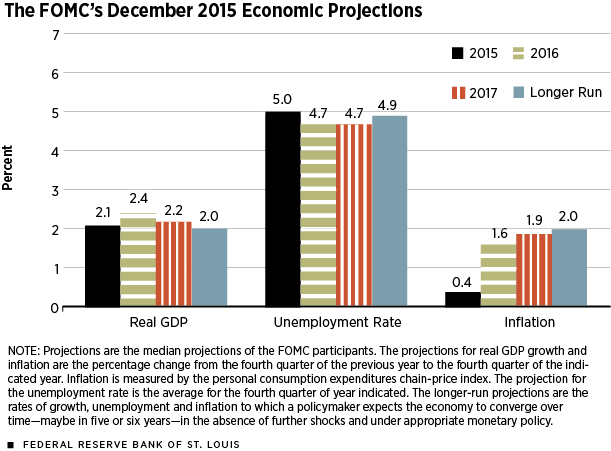
Despite some crosscurrents in the data, labor market conditions remained favorable at the end of 2015. For the year, nonfarm payroll job gains averaged 221,000 per month, the unemployment rate averaged 5.3 percent (it was 5 percent in each of the last three months) and real after-tax personal income increased briskly. Importantly, job gains were well above the levels necessary just to keep the unemployment rate constant. Given the favorable outlook for job growth, the unemployment rate should continue to fall in 2016.
Overall, the expectation of continued low energy prices, vibrant labor markets, low interest rates and healthy financial market conditions should keep consumer spending and home sales and construction growing at a healthy pace over the near term. These trends should also keep business spending on capital goods growing at a moderate pace.
Headline (that is, all items) inflation likely ended 2015 well below the Fed's 2 percent inflation target—something most other central banks have had to grapple with, as well. But the low headline inflation rate mostly reflects the sharp decline in crude oil prices. Measures of underlying inflation that attempt to remove transitory changes in prices show that inflation is much closer to the FOMC's 2 percent target. These measures include those produced by the Federal Reserve banks of Cleveland (trimmed mean consumer price index) and Dallas (trimmed mean personal consumption expenditures price index). Once oil prices stabilize—or maybe even rise slightly if some of the forecasts turn out to be right—headline inflation should rise from its current near-zero rate to something close to 2 percent. Oil prices, once again, are a wild card in the outlook. But even if inflation heads back up to 2 percent, the probability that inflation will exceed the Fed's target over the next 12 months is very low. That is the signal suggested by the St. Louis Fed's new inflation forecasting tool, the St. Louis Fed Price Pressures Measure.
Usa Kerdnunvong, a research associate at the Federal Reserve Bank of St. Louis, provided research assistance.
Views expressed in Regional Economist are not necessarily those of the St. Louis Fed or Federal Reserve System.
For the latest insights from our economists and other St. Louis Fed experts, visit On the Economy and subscribe.
Email Us


