


Assessing the Health of the Labor Market: The Unemployment Rate vs. Other Indicators
One of the goals of the Federal Reserve System, particularly of the Federal Open Market Committee (FOMC), is to achieve maximum employment. Therefore, staff and officials across the System put great effort into analyzing the current conditions of the labor market. Unfortunately, there is no widespread consensus on the definition of maximum employment or how far the economy is from it. Until recently, the unemployment rate has been the hallmark indicator of labor market health;1 even Fed Chair Janet Yellen argued in 2013 that "the unemployment rate is probably the best single indicator of current labor market conditions." 2
Currently, the unemployment rate stands very close to its natural level, indicating that the labor market has returned to some semblance of normal.3 However, unemployment may fall for reasons other than improved economic conditions. For example, it may fall when unemployed workers become discouraged and stop looking for work; then, they are no longer being counted as a part of the labor force.
In much of the recent policy debate, it has been argued that the current level of the unemployment rate may not be capturing all the relevant information about the health of the labor market and that it is best to look at a broad range of labor market indicators. Most notably, attention has shifted to variables like labor force participation, involuntary part-time employment and long-term unemployment.
Summarizing all this data is not a simple task since these different variables do not always move in tandem. For this reason, economists have developed several tools to distill key information that might be common to many of these observed variables (unemployment rate, labor force participation rate and dozens of other indicators) and might be driving those variables. In particular, the Federal Reserve Board of Governors and the Federal Reserve Bank of Kansas City introduced in 2014 indexes that they developed on labor market conditions.4 The goal of these indexes is to get a handle on "labor market conditions" or "labor market health"; these are terms that are not precisely defined and are even harder to measure.
Although these tools are indexes, much like the Consumer Price Index or the Industrial Production Index, the labor market conditions indexes use relatively sophisticated statistical procedures to weight some labor market variables more heavily than others. These statistical procedures let the data determine which indicators are more informative of the movements in the underlying labor market conditions.
In this article, I compare and contrast the labor market conditions indexes with one another and with the unemployment rate to see what labor market insights can be gained.
I found a couple of things. First, despite some differences in their construction and the variables used, the three indexes that I reviewed seem to provide essentially the same information. This similarity is not surprising since they are, after all, trying to capture the same object, namely the general health of the labor market. Second, the indexes have a strong negative correlation with the unemployment rate, that is, a rising index is associated with a falling unemployment rate. This strong link confirms that the unemployment rate is a reliable proxy for unobserved labor market health.
Measuring Labor Market Conditions
The goal of these indexes is to distill the information from a large set of observed labor market variables using a statistical model. Once the final index is calculated, the levels are interpreted as relative labor market conditions. A level higher than zero indicates that labor market conditions are above the historical average, while a level below zero indicates that labor market conditions are relatively poor compared with historical averages.
The index developed by the Federal Reserve Board of Governors (FRB) uses 19 labor variables of the U.S. economy. These variables are measured monthly; the sample starts in July 1976. The index is reported in average monthly changes instead of the index levels.
The Federal Reserve Bank of Kansas City has developed two indexes on labor market conditions; it uses 24 variables with a monthly frequency, and the sample starts in January 1992. The first index is interpreted as the level of conditions in the labor market; the second reflects the momentum, or changes, in these conditions.
Changes in Labor Market Conditions Indexes (LMCI) and in the Unemployment Rate
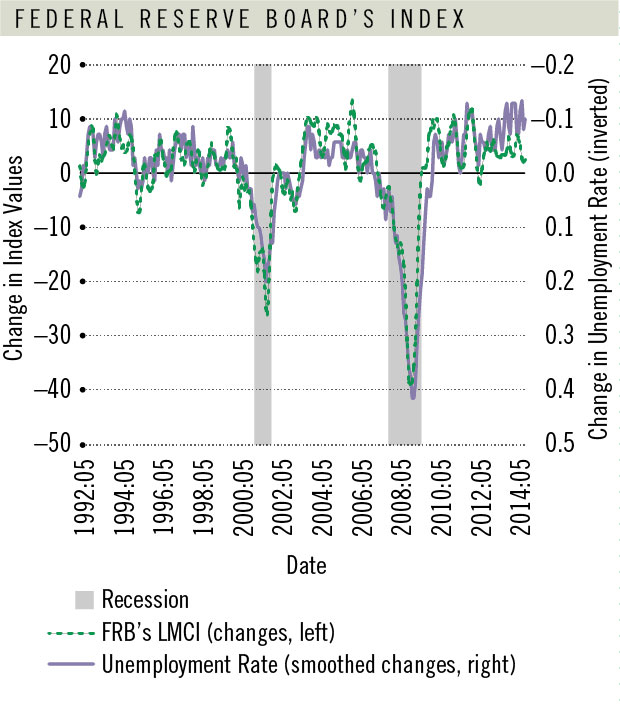
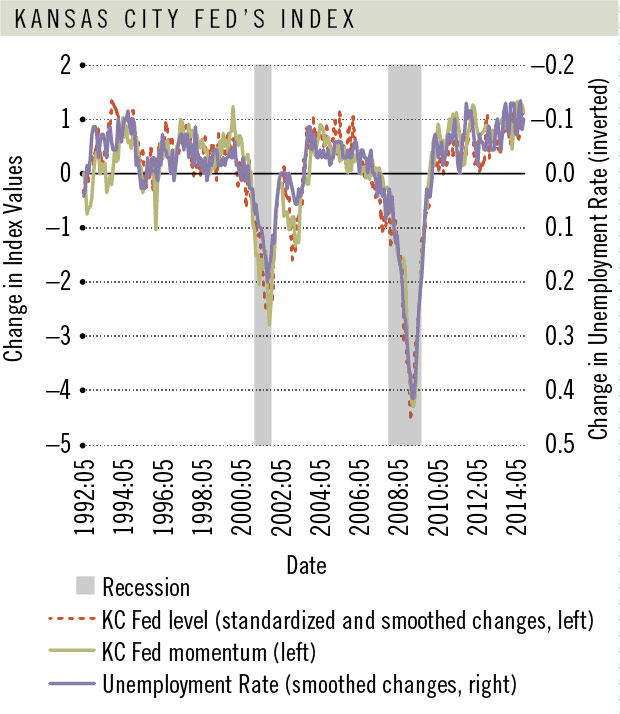
SOURCES: Author's calculations using data from the Federal Reserve Board of Governors, the Federal Reserve Bank of Kansas City and the Bureau of Labor Statistics.
Levels of Labor Market Conditions Indexes and the Unemployment Rate
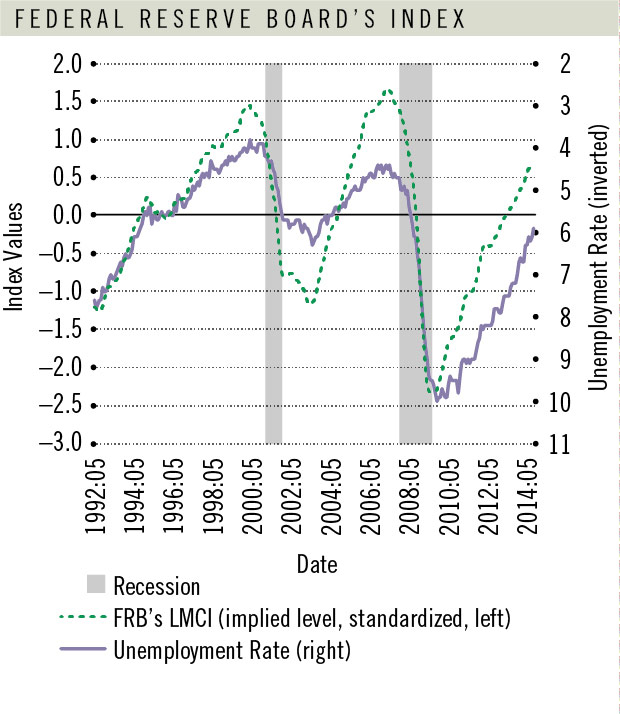
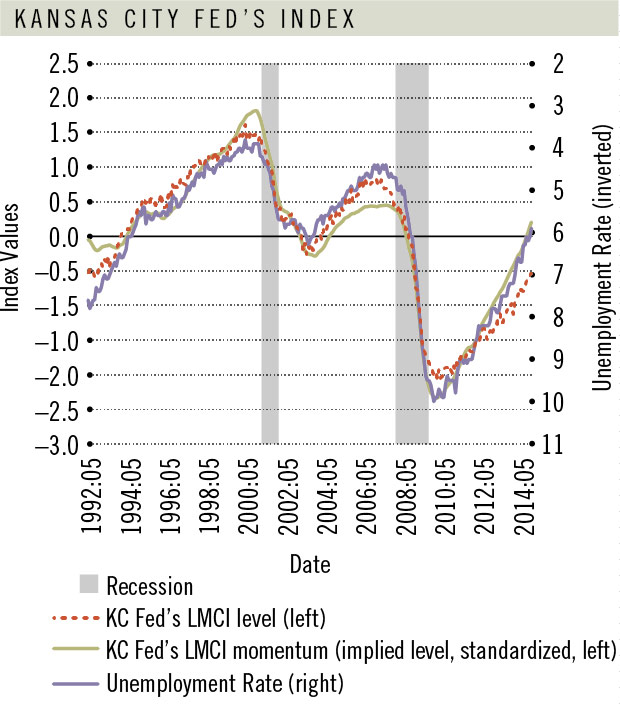
SOURCES: Author's calculations using data from the Federal Reserve Board of Governors, the Federal Reserve Bank of Kansas City and the Bureau of Labor Statistics.
Figure 1 shows the evolution of the changes in labor market conditions as captured by the different indexes, and Figure 2 shows the same evolution for the level of labor market conditions. For the FRB's index and the KC Fed's momentum index, I recovered the levels from the reported changes.5 As illustrated by the figures, the information that these three different measures provide is remarkably similar, which is not surprising since the statistical method to construct the different indexes is the same and they employ similar labor market variables.
In each of these figures, I also plotted the unemployment rate for the same period. Since in Figure 1 I analyzed the changes in the indexes, I also plotted the changes in the unemployment rate, while in Figure 2 I plotted the levels.6 In periods of expansion, labor market conditions, as captured by the different indexes, improve and the unemployment rate falls. The opposite happens in downturns. To ease the comparison between the indexes and the unemployment rate, I inverted the axis for the unemployment rate in the figures.
It is evident from the figures that the unemployment rate and the indexes are highly synchronized. While nothing in the statistical procedure behind the indexes imposes this strong link between them and the unemployment rate, the data suggest that the unemployment rate is very informative of the underlying conditions in the labor market. In fact, a simple linear regression between the unemployment rate and the different indexes suggests that the bulk of the variability of the unemployment rate is due to movements in the indexes.7
While labor market conditions are not directly observed, the previous results lead to an important conclusion. If we were to use only the unemployment rate, or its changes, to predict the conditions in the labor market, the prediction error would be small. In other words, the unemployment rate has a very high signal-to-noise ratio for measuring labor market conditions.
Conclusion
The U.S. economy has recently experienced the largest economic downturn in postwar history. Five years have passed since the official end of the recession, yet the difficult question on how far we are from full employment remains.
With unemployment returning to normal levels, it has been argued that the unemployment rate may not properly capture the current amount of slack in the economy; as a result, labor market conditions indexes have been proposed as a new measure of labor market health. These indexes have the advantage of summarizing information from many different variables. At the same time, they are the result of a statistical procedure requiring several steps to compute and a nontrivial amount of judgment.
In this article, I showed that the unemployment rate is reflective of underlying labor market health, as represented by the indexes. In addition, a closer inspection of the figures suggests that this strong link between the indexes and the unemployment rate does not appear to have changed recently, which suggests that the unemployment rate is still as good at measuring labor market conditions as it has been in the past.
Endnotes
- The unemployment rate is defined as the ratio of people actively looking for work to the sum of people actively looking for work and those currently employed. [back to text]
- In 2013, Janet Yellen was vice chair of the Federal Reserve. For more information on her remarks on the unemployment rate and its role in monetary policy, see Yellen. [back to text]
- Under this view, the concept of natural rate of unemployment, the rate that will prevail in the long run in the absence of short-term cyclical factors, can provide adequate information on the level of maximum employment. The Congressional Budget Office most recently estimated the natural rate of unemployment to be between 5.5 percent and 5.8 percent in 2014. [back to text]
- See Hakkio and Willis, as well as Chung et al. [back to text]
- I call these implied levels. [back to text]
- To eliminate some of the very high frequency volatility on the monthly changes in the unemployment rate, I take a seven-month centered moving average on these changes with equal weights, which is what I present in the graph. At the end of the period, this average contains only current and past values. [back to text]
- In statistical lexicon, the R2 for these regressions is close to 1. [back to text]
References
Chung, Hess; Fallick, Bruce; Nekarda, Christopher; and Ratner, David. "Assessing the Change in Labor Market Conditions." FEDS Notes, May 22, 2014. See www.federalreserve.gov/econresdata/notes/feds-notes/2014/assessing-the-change-in-labor-market-conditions-20140522.html.
Hakkio, Craig S.; and Willis, Jonathan L. "Kansas City Fed's Labor Market Conditions Indicators (LMCI)." The Macro Bulletin, Aug. 28, 2014. See http://kansascityfed.org/publicat/research/macrobulletins/mb14Willis-Hakkio0828.pdf.
Yellen, Janet L. Speech at the 2013 National Association for Business Economics Policy Conference. See www.federalreserve.gov/newsevents/speech/yellen20130302a.htm.

Views expressed in Regional Economist are not necessarily those of the St. Louis Fed or Federal Reserve System.
For the latest insights from our economists and other St. Louis Fed experts, visit On the Economy and subscribe.
Email Us