


Metro Profile: Long-Resilient Little Rock Faces Uncertain Pace of Recovery
In 1722, French explorer Jean-Baptiste Bénard de La Harpe identified a rock jutting out along the bank of the Arkansas River as la petite roche, or "the little rock." It signified the geographic transition from the alluvial plains formed by the Mississippi River to the east and the Ouachita Mountain foothills to the west. Over the past century, Little Rock has transitioned from an economy that produced lumber and cottonseed to one that predominantly provides services—the lion's share of which is in health, education and state government.
The Little Rock-North Little Rock-Conway metropolitan statistical area (henceforth, Little Rock) is the largest metro area in Arkansas, with an estimated population of 717,666. All counties in this area experienced growth in population between 2002 and 2012, aside from Perry County, which declined by a marginal 0.2 percent. In aggregate, the Little Rock metropolitan statistical area (MSA) grew in population by nearly 15 percent, faster than Arkansas and the nation (9.0 percent and 9.3 percent, respectively). Pulaski County—home to almost half of the area's population, including the city of Little Rock—grew by 6.8 percent. The bulk of the MSA's growth came from the outlying area; all counties, except Perry in the northwestern corner of the MSA, grew faster than Pulaski.
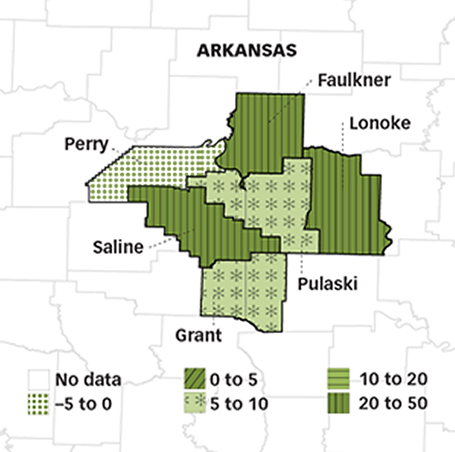
This population expansion was accompanied by similar, though less uniform, trends in personal income growth. In real terms, personal income per capita increased in all counties in the metro area. Pulaski County, which has the highest per capita income, saw its income grow in real terms by 9.1 percent over the past decade, a rate that was outpaced by Faulkner (11.2 percent), Perry (16.5 percent), Lonoke (9.5 percent) and Saline (24.8 percent) counties. (Per capita income growth in the nation grew 11.4 percent over the same period.) Thus, incomes for most of the counties in the metro area are converging.
Resiliency during the Recession
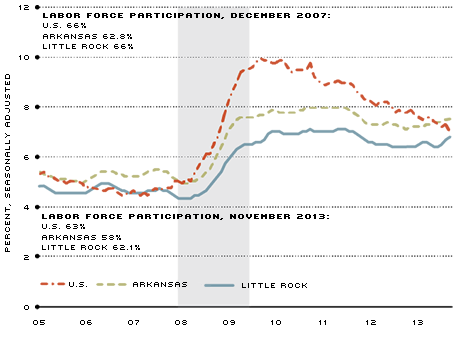
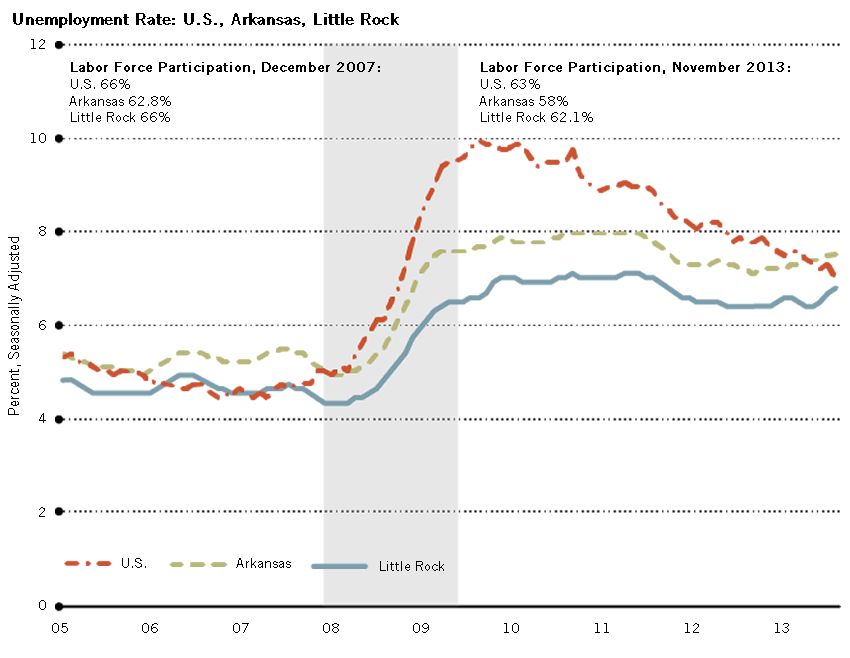
Prior to the recession, the unemployment rate in Little Rock tracked the national average; since then, the metro area's economy has proved to be more resilient than the nation's. From peak to trough, the U.S. shed 6.3 percent of its payroll employment, whereas Little Rock lost 4.7 percent. As for the unemployment rate, Little Rock's rose at a slower pace than the nation's and peaked at 7.1 percent. The unemployment rate stood at 6.8 percent in November in Little Rock. Some of the differences in the unemployment rate can be accounted for by changes in labor force participation. Immediately prior to the recession, the participation rate in Little Rock mirrored the national rate. During the course of the recession, labor force participation in Little Rock is estimated to have declined faster than—and remained below—the national participation rate.[1]
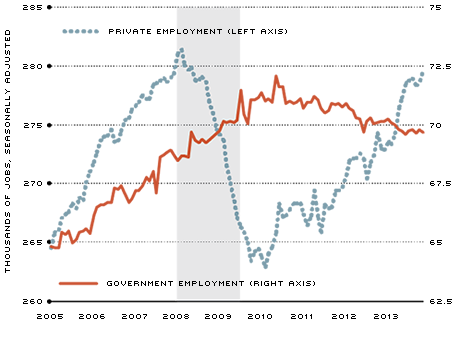
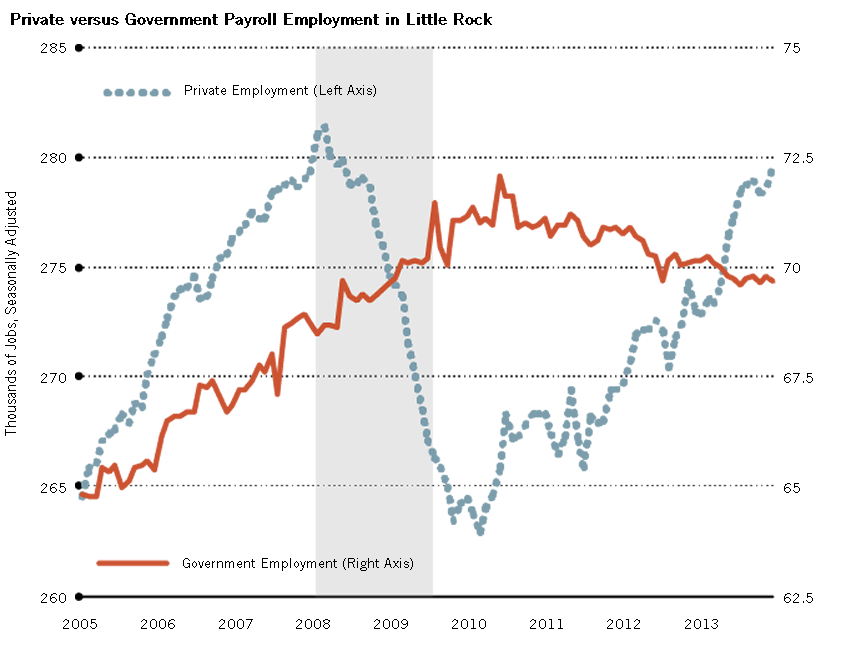
Little Rock's resilience during and throughout the recession can be attributed to the confluence of three factors: (1) the metro area was less exposed to the housing crisis; (2) a substantial portion of employees work for state and local governments; and (3) the health and education services sector continued to grow along a prerecession trend. It is worthwhile to note that both state government and health and education services experienced sustained year-over-year growth throughout the recession and currently account for about one out of every four jobs in Little Rock.
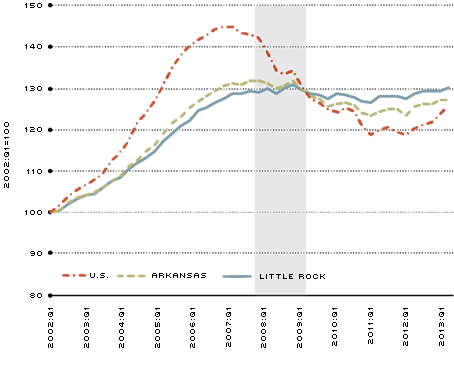
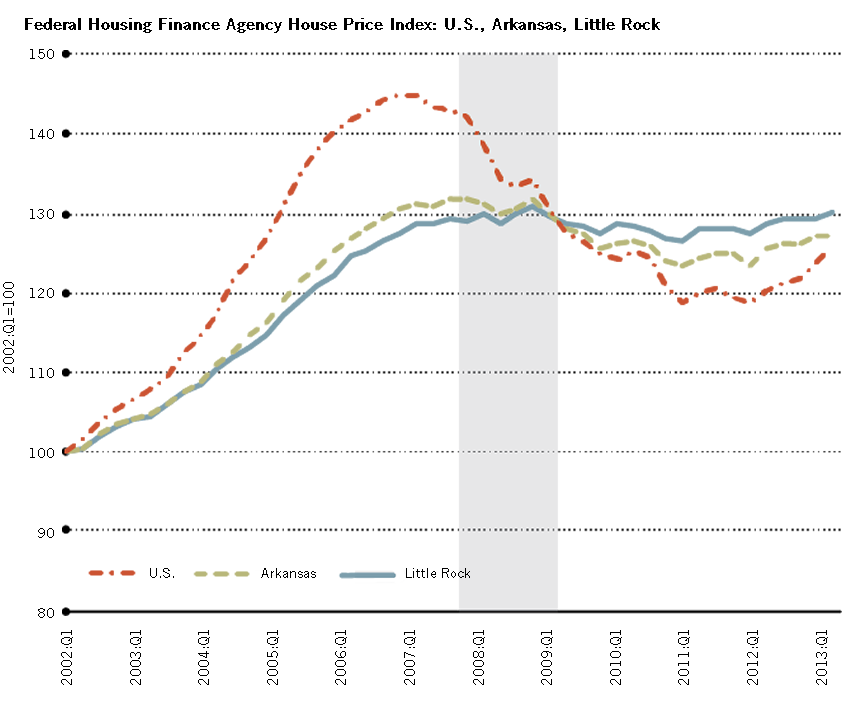
A key feature of the recession was the steep decline of housing prices across the nation. In Little Rock, house prices rose before the financial crisis at a slower pace than they did nationwide and declined temperately during the ensuing crisis. Little Rock, and Arkansas more generally, was less exposed to the cyclical volatility and risk inherent in the prerecession real estate buildup. U.S. house prices rose by nearly 50 percent between 2002 and 2007; in Little Rock, they rose by about 30 percent. As house prices collapsed, the nation's house price index dropped considerably, bottoming out in the second quarter of 2011 after declining by about 20 percent. The house price index in Little Rock declined by only 3 percent from its prerecession maximum.
The Arkansas state government is the largest single employer in the Little Rock area, employing 9.4 percent of the area's workers and contributing, along with local government, about 13 percent to the metro area's gross output. The rest of the Little Rock economy declined significantly throughout the recession even as the state and local government employment grew year over year.
Across the country, growth in state tax revenue experienced an earlier, deeper decline during the recession and rebounded at a later point than did Arkansas tax revenue. In Arkansas, the muted decline in revenue and the relatively fast rebound helped to insulate the Little Rock economy because large portions of the workforce were employed by the state.
Health and education services expanded along prerecession trends throughout and beyond the recession. In 2007, just before the economic downturn, this sector employed 13.6 percent of the workforce though it only contributed 8.2 percent to regional production. While the economy was officially in recession, this sector added more than 1,500 jobs even as the rest of Little Rock shed just over 14,000 jobs. The net downward effect on employment was dampened by the well-established health and education services sector in the region.
Current Conditions
Since January 2012, employment in state and local governments has steadily declined by an average of 0.65 percent year over year, possibly reflecting the end of federal stimulus money as well as the lagged effect of lower state tax revenue in recent years.[2] In recent months, the shutdown of the federal government revealed how reliant Arkansas state employees are on federal funding. During the shutdown, Gov. Mike Beebe suspended all state programs that depend upon federal funding, directly affecting 673 state employees already on furlough.[3] Although political brinkmanship concerning the federal budget subsided at the end of the year, the Little Rock economy remains exposed to such budgetary crises in Washington.
Of the 55 largest hospitals and medical centers in Arkansas, 14 are located in the Little Rock MSA.[4] About one-third of all jobs in the health and education services sector across the state are in Little Rock. Although this industry has seen large payroll growth in recent years, much like the state and local governments, the health-care sector still faces significant economic and regulatory challenges.
With the implementation of the Affordable Care Act, Little Rock has found itself on the national stage: Late in September, the federal government approved a plan to allow Medicaid funding to be used to purchase private insurance in Arkansas—the first state to win such approval. The fiscal impact of this approach is unclear at this point; nonetheless, this sector may benefit from the uptick in demand for services and the ability to pay from the newly insured population. As of late October, more than 66,000 Arkansans statewide have applied for health insurance under this Medicaid expansion plan.[5]
Little Rock's ability to weather the recession better than the nation and the state was, in large part, dependent upon consistent employment growth at all levels of government, mostly state government. However, this is the only sector that has fared worse since the rebound in employment began in early 2010 when compared with its performance during the recession. This trend reversal in Little Rock follows patterns seen across the nation for government employment.
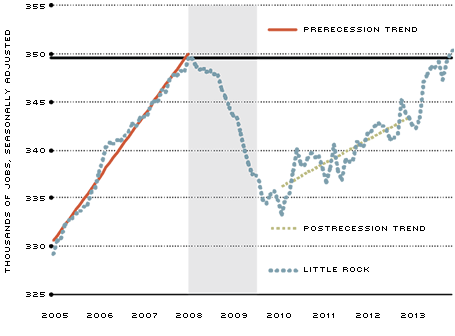
Though faring relatively well during the recession, employment continued to decline in Little Rock for eight months beyond June 2009—when the nation officially emerged from the recession. Nearly all industries in Little Rock were affected by this period of enduring contraction. In early 2010, employment in Little Rock hit its trough and began to recover, though at a slower pace when compared with the nation and with the metro area's prerecession growth patterns.
Between 2010 and 2012, Little Rock added approximately 3,500 jobs per year—far less than the approximately 6,000 jobs its economy was adding per year prior to the recession. These total figures do not fully capture sector-level dynamics. Despite bolstering the Little Rock economy during the recession, the government sector experienced flat-line growth during this nascent stage of the recovery. Countervailing this slowdown was growth in the private sector, which added jobs at nearly the same rate as before the recession. Relative to the nation, however, most industries outside of the government sector grew at a slower rate.
Since 2013, payroll employment growth has picked up. For the first 11 months of 2013, Little Rock's payroll employment was up by an annualized 2.0 percent, at pace with the nation. In aggregate, Little Rock outstripped its prerecession pace of job creation and was on pace to add roughly 7,000 jobs by the end of 2013—driven primarily by growth in professional and business services, retail trade, and health and education services. Professional and business services jobs alone accounted for half of all jobs created in 2013; another 30 percent of the new jobs were in health and education services. Total employment grew at such a pace that the Little Rock economy breached the prerecession peak in late 2013; as of November, employment exceeded that peak by 500 jobs.
So, the signals on the economy in Little Rock continue to be mixed. Government payroll employment not only continued to decline in 2013, but it shed jobs at a quickening pace. On the other hand, broad improvements in the real estate sector have led to the creation of construction jobs at a rate not seen since before the recession. Overall, it is still unclear whether the uptick in growth in the MSA is yet another intimation of the region's economic resiliency observed during the recession or simply a transitory divergence along a slower expansionary trend.
Unemployment Rate: U.S., Arkansas, Little Rock
SOURCE: Bureau of Labor Statistics.
NOTE: The shaded area indicates a U.S. recession. Data are easily accessible in the St. Louis Fed's economic database, FRED, using these series IDs: Little Rock (LRSUR), Arkansas (ARUR) and U.S. (UNRATE).
Federal Housing Finance Agency House Price Index: U.S., Arkansas, Little Rock
SOURCE: Federal Housing Finance Agency.
NOTE: The shaded area indicates a U.S. recession. Data are easily accessible in the St. Louis Fed's economic database, FRED, using these series IDs: Little Rock (ATNHPIUS20780Q), Arkansas (ARSTHPI) and U.S. (USSTHPI).
Private versus Government Payroll Employment in Little Rock
SOURCE: Bureau of Labor Statistics.
NOTE: The shaded area indicates a U.S. recession. Data are easily accessible in the St. Louis Fed's economic database, FRED, using these series IDs: Government Employment in Little Rock MSA (LRSGOVT), and Private Employment can be calculated as Nonfarm Payroll (LRSNA) less Government Employment (LRSGOVT).
Employment in Little Rock
SOURCE: Bureau of Labor Statistics.
NOTE: The shaded area indicates a U.S. recession. The black horizontal line is the prerecession seasonally adjusted peak of 349,600 nonfarm jobs. The prerecession trend line is estimated from data from January 2005 through January 2008 (slope: 541 jobs per month); the postrecession trend line is estimated with data from January 2010 through December 2012 (slope: 212 jobs per month). Data are easily accessible in the St. Louis Fed's economic database, FRED, using the following series ID: Little Rock (LRSNA).
MSA Snapshot
Little Rock-North Little Rock-Conway, Ark.
| POPULATION |
717,666
|
| LABOR FORCE |
341,098
|
| UNEMPLOYMENT RATE |
6.8%
|
| PERSONAL INCOME (PER CAPITA) |
$41,662
|
Largest Sectors by Employment

Growth in Per Capita Income by County 2002-2012
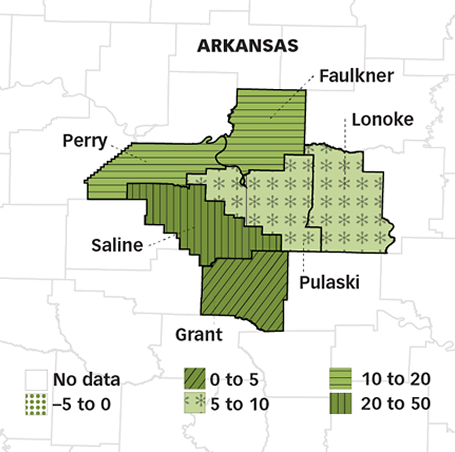
Growth in Population by County 2002-2012
NOTES: Population, employment and personal income per capita data are from the Census Bureau, Bureau of Labor Statistics and Bureau of Economic Analysis. These MSA-level data series are easily accessible in the St. Louis Fed's economic database, FRED (Federal Reserve Economic Data). For the panels and maps, see these FRED series (IDs in parentheses): population (LRSPOP); labor force (LRSLF); unemployment rate (LRSUR); personal income (LRSPCPI); leisure and hospitality (LRSLEIH); professional and business (LRSPBSV); and education and health (LRSEDUH). State government and retail trade employment data are contained within the following aggregate data series, which are also available on FRED: government (LRSGOVT) and trade, transportation and utilities (LRSTRAD).
Endnotes
- Authors' calculations of labor force participation rates in Little Rock. [back to text]
- By Sept. 30, 2010, 70 percent of the stimulus money had been doled out; by Sept. 15, 2011, nearly 85 percent of the stimulus package had been paid out and the large majority of the remaining funds were already obligated for use in upcoming projects. See "Memorandum for the Heads of Executive Departments and Agencies," at www.whitehouse.gov/sites/default/files/omb/memoranda/2011/m11-34.pdf. [back to text]
- Demillo, Andrew. Associated Press, Oct. 9, 2013, "Mike Beebe: No More State Money for Federal Programs." Arkansas Business. [back to text]
- Arkansas Book of Lists 2013: The Ultimate Guide to Who's Who in Arkansas Business, Vol. 29, No. 53, Dec. 31, 2012, to Jan. 6, 2013. Most hospitals and medical centers reported as of the end of the 2012 fiscal year. Reported values were compared to the average nonfarm payroll in 2011. Jobs reported by hospitals are full-time employees. [back to text]
- Associated Press, Oct. 24, 2013, "Arkansas Signs 62K People for State Health Insurance." [back to text]

Views expressed in Regional Economist are not necessarily those of the St. Louis Fed or Federal Reserve System.
For the latest insights from our economists and other St. Louis Fed experts, visit On the Economy and subscribe.
Email Us