


District Overview: Engines of Growth Vary in Four Largest Cities
Since the recession officially ended in June 2009, the U.S. economy has experienced steady growth in jobs at a pace of about 1.5 percent per year. However, the recovery has not been uniform across sectors of the economy or across regions. Take, for example, the four major metropolitan statistical areas (MSAs) in the Eighth District: St. Louis; Little Rock, Ark.; Louisville, Ky.; and Memphis, Tenn. Employment growth in the Louisville MSA has been the fastest, with the manufacturing sector contributing the most jobs. Growth in the three other MSAs has been slightly below the national rate. Which sectors are driving the recoveries in these four MSAs? An examination of common performance metrics helps to identify them.
Two Important Metrics
One of the most popular metrics used by economists to identify key industries within a region is location quotients (LQs) for each sector. An LQ is a way to measure how concentrated an MSA's employment is within a sector relative to the nation's. It is calculated by dividing the share of employment in a given sector within a region by
the sector's share of national employment over a given period.[1] If an LQ has a value of 1, the regional and national shares are the same; values less than 1 indicate the region employs relatively fewer workers; values greater than 1 indicate the region employs relatively more workers than the nation does. For example, the LQ for Memphis' transportation and utilities sector is 3.2, indicating that Memphis employs 3.2 times as many workers in this sector than the national average. In this case, 10.6 percent of Memphis' workers are employed in the transportation and utilities sector, compared with the national average of 3.3 percent.
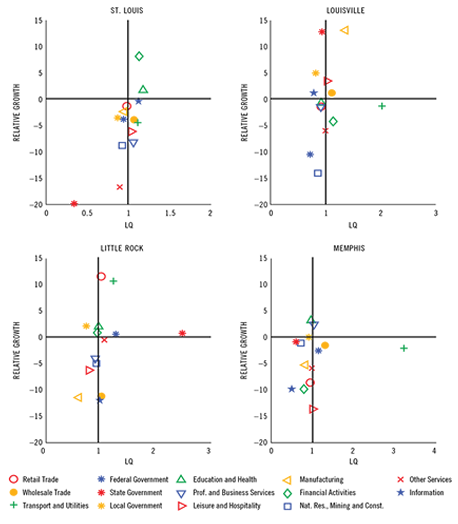
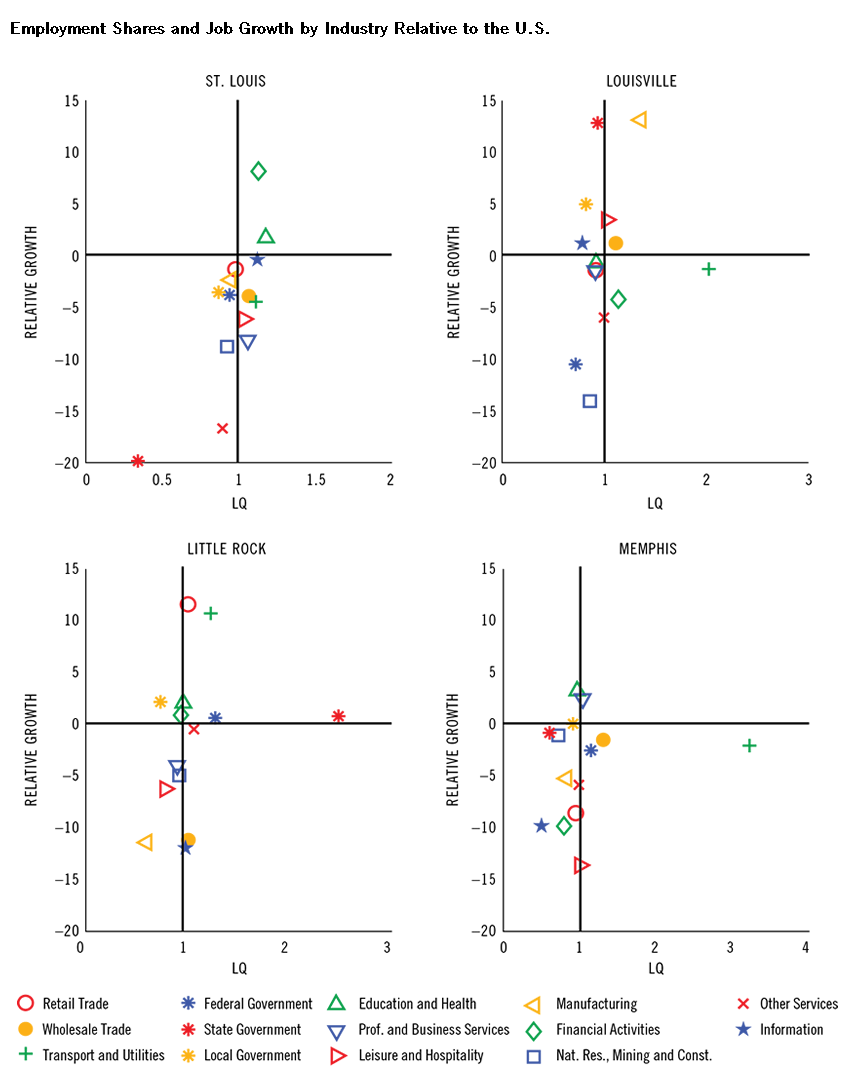
Employment Shares and Job Growth
by Industry Relative to the U.S.
SOURCES: Bureau of Labor Statistics and authors' calculations.
NOTE: The figure plots the location quotients (LQs) and relative growth rates for each two-digit North American Industry Classification System (NAICS) industry within the metro area calculated using data between 2009:Q3 (the start of the recovery) and 2013:Q3. An LQ of 1 means the regional and national shares are the same; values less than 1 indicate the region employs relatively fewer workers, and values higher than 1 indicate the opposite. "Relative growth" measures the difference between local growth and national growth in percentage points, with 0 marking the national average.
A second metric is the difference between an industry's employment growth rate regionally and its growth rate nationally. Just as we compare overall growth of a region to a national benchmark, comparing the regional growth of industries to a national benchmark can help identify the sectors generating local growth or leading a national trend. For example, in the St. Louis MSA, employment growth in the financial activities sector has increased by about 9.6 percent since the recession ended; nationally, employment in this sector has increased by 1.5 percent, for a relative growth rate 8.1 percentage points above the national average. Relatively stronger employment growth may be an indication that: (1) factors specific to the region are generating growth in this sector; (2) major employers are hiring and/or relocating workers to the region; or (3) firms belonging to that sector are expanding in the region.
Combining these two metrics is one way to identify the sectors that have been important to a region's growth. The figure plots the industry LQs for each metro area on the horizontal axis and the relative growth rate for the industry on the vertical axis. One way to interpret the figure is to cluster the industries based on their quadrant in the graph.
Industries in the upper-left quadrant employ relatively fewer workers regionally compared with the nation, but the growth rates of these industries have been faster than their national averages. These sectors may be considered "emerging" industries for the region. In Memphis, the education and health services sector is one of these industries; the sector has an LQ of 0.9 and a growth rate that is 3 percentage points higher than the national rate.
Industries in the bottom-left quadrant employ relatively fewer workers regionally and are growing at slower rates than the corresponding industries at the national level; these may be considered "noncompetitive" sectors.
The industries in the bottom-right quadrant of the graph employ a relatively larger share of workers but are growing slower than the national average. These industries may have significant importance to the region. For example, in Memphis, the transportation sector stands out among the rest, with an LQ of more than 3 and a growth rate just below the national rate.
The upper-right quadrant is the most likely place for a region's important growth industries to be located. These sectors employ a relatively larger share of workers than the national average, and their employment growth rates exceed the national rates. In St. Louis, the financial activities sector stands out in the graph. The sector employs about 6.6 percent of the region's workers, versus 5.8 percent nationally (with an LQ of 1.1), and the relative growth rate was more than 8 percentage points higher than the national rate. The education and health services sector is also in the upper-right quadrant, with an LQ of 1.2 and a growth rate that is 1.7 percentage points higher than the national average.
In Louisville, the manufacturing and wholesale trade sectors are in the upper-right quadrant. Louisville's manufacturing sector has grown 13.1 percentage points faster than the national rate, which is five times as fast (16 percent locally versus 2.9 percent nationally).
Little Rock, as the state capital, employs a relatively larger share of state government workers, with an LQ of 2.5 and the relative growth rate of 0.7 percentage points. Unlike in the other MSAs, all three levels of government employment in Little Rock (federal, state and local) have relative growth rates above zero.
Another metric, the standard deviation of each region's LQs, is used to determine the relative level of specialization. By this metric, the St. Louis MSA may be considered the most diversified across sectors: Its largest LQ is 1.2 and its smallest is 0.3, with a standard deviation of 0.2. Memphis may be the most specialized of the four MSAs, with LQs ranging from 3.2 to 0.5.
Metrics beyond Employment
While most regional analysis tends to focus on employment metrics—in part due to their availability, long history and timely release—many other metrics may be used. For example, since 2007 the Bureau of Economic Analysis has reported gross metropolitan product (GMP) and has disaggregated the data by sector. These data reinforce some of the trends noted above: Between 2009 and 2012, financial activities in St. Louis were the largest reported contributor to GMP growth (0.64 percentage points of the total 3.62 percent growth). Over the same period in Memphis, the transportation and utilities sector was the largest contributor to growth (1.38 percentage points of the total 3.78 percent growth).
The trade in goods (imports and exports) for each metro area is another useful metric for identifying important sectors. The data are collected by the Census Bureau and are organized and repackaged by the Brookings Institution.[2] Regional trade data show the flows of products internationally and domestically. If a region is a net exporter of a good, the region is thought to be producing more of a product than it needs for local consumption. On the other hand, a region may be a net importer of products that are used as inputs into a production process. Of the four major MSAs in the District, Memphis was the only net exporter of goods in 2010, with a trade surplus of $29.3 billion, driven by exports of chemicals and plastics ($32 billion). The MSA with the largest trade deficit was Louisville, with a net balance of $24.4 billion in imports, $10.5 billion of which were imports of chemicals and plastics.
Future investigation into regional trade flows data may provide additional insights into the sectors that are driving growth in the District's largest metro areas.
Endnotes
- All of the calculations in this article use data from 2009:Q3 through 2013:Q3 unless otherwise noted. [back to text]
- See Tomer et al. [back to text]
References
Tomer, Adie; Puentes, Robert; and Kane, Joseph. "Metro-to-Metro: Global and Domestic Goods Trade in Metropolitan America," Global Cities Initiative: A Joint Project of the Brookings Institution and JPMorgan Chase, October 2013.


Views expressed in Regional Economist are not necessarily those of the St. Louis Fed or Federal Reserve System.
For the latest insights from our economists and other St. Louis Fed experts, visit On the Economy and subscribe.
Email Us