District Overview: Multifamily Rental Housing Is Growing: “Yesterday's Buyer Is Today's Tenant”
While housing prices are recovering slowly from the bursting of the bubble, there's one segment of the real estate market that has seen robust growth: multifamily housing (buildings with more than four residential rental units). Activity in this segment has been expanding both in terms of rising apartment rents and declining vacancy rates.
In this article, we consider the period between 2006:Q1 and 2009:Q2 as the period when the bubble burst and the quarters between 2009:Q2 and 2012:Q3 as the recovery period.
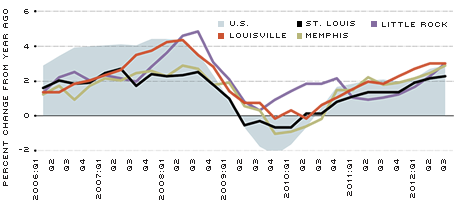
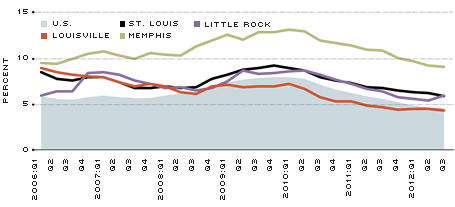
As shown in the figures, the nation's weighted average asking rent for apartments increased by 5.0 percent during the recovery period, while the nation's vacancy rate for apartments decreased from 7.7 percent in 2009:Q2 to 4.6 percent in 2012:Q3. All of the major urban areas of the Eighth District—Little Rock, Louisville, Memphis and St. Louis—showed very similar changes for "asking rents," and all but one of these urban areas—Memphis—did the same for "vacancy rates."
Asking Rents for Apartments Increase for All Four Metropolitan Statistical Areas (MSAs)

SOURCE: Reis.com.
Vacancy Rates for Apartments Continue To Decline for All Four MSAs

SOURCE: Reis.com.
The Dynamic of Housing Prices1
In terms of housing price indexes, until 2012, the Eighth District performed better than the average national level during the housing contraction and the recovery periods. During the 13 quarters of contraction, home prices in the four zones of the District—zones based in Little Rock, Louisville, Memphis and St. Louis—fell by 10.3 percent on average (weighted by population), substantially less than the nation's contraction of 29.3 percent. Prices in the Little Rock and Louisville zones fell by only 3.3 percent and 2.0 percent, respectively, while prices in the Memphis and St. Louis zones fell by 13.3 and 12.5, respectively.2
The Eighth District's zones show some diversity in the pace of the recovery of home prices. As of the third quarter of 2012, the available data indicate that the Little Rock and Louisville zones were experiencing positive year-over-year growth in home prices, while the Memphis and St. Louis zones were still suffering declines. Among the four zones, the housing market in the Little Rock Zone has suffered the least. For the first three quarters of 2012, the Little Rock Zone had consecutive positive growth rates on a year-over-year basis, while the other three zones had at least one quarter with a decline or no growth at all.
Meanwhile, the nation's year-over-year growth rate in house prices was, at first, lower than the growth rates in the Little Rock, Louisville and Memphis zones, but interestingly, starting at the beginning of 2012, the nation's growth rate gradually outpaced those of the four zones. In the third quarter of 2012, the year-over-year growth rate for the nation was 4.4 percent, almost twice as high as the growth rate of home prices in the Little Rock Zone.
Strong Multifamily Rentals
"Yesterday's buyer is today's tenant," one real estate agent in the Eighth District recently said. Multifamily rental activity has been the bright spot of the housing market since mid-2010. Both data and anecdotal evidence suggest a robust increase in apartment rents, as well as a continuous decrease in vacancy rates. During the recovery period, the "asking rent" for apartments in the MSAs of Little Rock, Louisville, Memphis and St. Louis increased by 6.6 percent, 5.9 percent, 4.7 percent and 4.3 percent, respectively, while the nation's increased by 5.0 percent.
In the third quarter of 2012, vacancy rates in the Little Rock, Louisville, Memphis and St. Louis MSAs and in the nation declined to 6.0 percent, 4.3 percent, 9.1 percent, 5.9 percent and 4.6 percent, respectively, reaching their lowest levels since 2002 (Figure 2). During the recovery period, apartment vacancy rates in Little Rock, Louisville, Memphis and St. Louis dropped by 31.0 percent, 37.7 percent, 24.8 percent and 33.0 percent, while the nation's fell by 40.3 percent.
Among the four MSAs, Louisville's performance is outstanding: The vacancy rate has been below the national level since the first quarter of 2009 and far below Louisville's precrisis levels. According to a real estate agent in Louisville, for the attractive projects, the average occupancy rate in the third quarter of 2012 was 96-97 percent and waiting lists have become common. As the market for apartments expands, the Louisville data also point to an increase of permits for this segment of the market, which has been recovering steadily since 2008.
Reasons
What explains the fast-closing gap between the demand and supply of apartments? First, the availability of finance has become an important barrier for potential homeowners. Despite the historically low mortgage interest rates and the high housing affordability index, many prospective buyers for new and existing homes are being rejected by mortgage providers due to underwriting standards that are stricter now than before the real estate crisis. According to several real estate agents in the Eighth District, applicants with even the slightest blemishes on their credit records are being refused mortgages, even if they are well-employed.
Second, potential first-time homebuyers are facing competition from investors, who can pay cash up front. Private investors, real estate investment trusts (REITs), public and private pension funds, and venture capitalists are becoming more active in the housing market. Some of these companies, such as venture capital enterprises, pool financial resources to invest in the apartment segment, anticipating hefty profits from "buy now and sell later" strategies. One indicator of the success of this strategy is that the stock price of apartment REITs increased by roughly 325 percent from February 2009 until August 2012, while all REITs and the S&P 500 increased by 210 percent and 120 percent, respectively, during the same period.3 One homebuilder described the market as a "capital-starved" industry.
Third, renting has become more appealing to younger people who, before the crisis, would have been eager homebuyers. In part, this is a response to changes in lifestyle, as younger more-educated households prize their mobility and flexibility; they are also discouraged by the substantial responsibilities, costs and, especially, risks attached to homeownership. In the end, they are more willing to pay rent than to own equivalent properties. Another reason for younger generations to be skittish about buying homes stems from their being scarred by the labor market outcomes of the Great Recession; they are having trouble finding jobs that match their skills—or finding any job.
What Does the Future Hold?
The robust multifamily rental market is triggering a strong response in the multifamily construction segment. Anecdotal evidence suggests that multifamily developers have intensified the search for new projects; even those companies that normally focus on offices are looking to invest in multifamily housing. As supply adjusts, the increase in rents could decelerate.
While the multifamily segment is sending positive signals through most of the Eighth District, its developments have also raised some concerns.
In particular, the target home size of move-up homebuyers is shrinking. Traditional real estate markets consist of first-time buyers and repeat buyers, whether move-up, move-across or move-down. Before the crisis, first-time buyers would easily and relatively quickly move up and acquire larger, pricier homes. The current residential market, however, is characterized by an increased presence of investors, far fewer first-time buyers and a declining number of move-up buyers.4 In the current environment, traditional buyers have much less room to maneuver because of difficulties in accessing mortgage financing, either through first mortgages or through refinancing. As a result, either by choice or by force, many households are currently paying rent that is substantially higher than the mortgage payment for an equivalent property. These higher payments are probably curtailing consumer spending on other goods and services.
What's more, homeownership has declined significantly during the recovery period. For example, homeownership rates in Louisville, Memphis and St. Louis have decreased by 8.0 percent, 5.3 percent and 0.6 percent, respectively (data for Little Rock are not available), while the nation's rate has decreased by 2.9 percent.
Endnotes
- In this article, home prices are measured by the CoreLogic Home Price Index (HPI), which includes distressed sales, unless otherwise specified. The HPI is a weighted, repeat-sales index, meaning that it measures average price changes in repeat sales or refinancing on the same properties in 363 metropolises. The aggregated home price index for the four zones—Louisville, Little Rock, Memphis and St. Louis—is calculated as the average of the home price indexes of the counties within the zones, weighted by population. The same methodology was used for home prices for the Eighth District. [back to text]
- Cohen, Jeffrey P.; Coughlin, Cletus C.; and Lopez, David A. "The Boom and Bust of U.S. Housing Prices from Various Geographic Perspectives." Federal Reserve Bank of St. Louis Review, September/October 2012, Vol 94, No. 5, pp. 341-67. [back to text]
- "Apartment REITs Surging." See www.nuwireinvestor.com/articles/apartment-reits-surging-59880.aspx [back to text]
- "Repeat Home Buyers a Rare Breed." See www.sfgate.com/realestate/article/Repeat-home-buyers-a-rare-breed-3829628.php [back to text]
Views expressed in Regional Economist are not necessarily those of the St. Louis Fed or Federal Reserve System.
For the latest insights from our economists and other St. Louis Fed experts, visit On the Economy and subscribe.
Email Us

