


Online Extra: Mortgage Borrowing: The Boom and Bust
Mortgage borrowing experienced a spectacular boom and bust in recent years. This did not occur uniformly across the age distribution of the population, however. The largest increases in the average dollar value of mortgage debt per family between 2000 and 2008, as well as the largest decreases between 2008 and 2012, occurred among families headed by people in their late 30s or early 40s. In percentage terms, the largest increases between 2000 and 2008, as well as the sharpest declines between 2008 and 2012, were among families headed by people in their mid- to late 20s.
In contrast to the extreme volatility in mortgage balances owed by young families, the largest net percentage increases in average mortgage debt, from the beginning of the boom in 2000 to the present day, typically were among families headed by people in their 60s or 70s. These families, born in the 1950s or earlier, experienced more-moderate increases through 2008 and very small declines between 2008 and 2012.
Thus, the mortgage boom and bust of the last dozen or so years conceals a wide variety of experiences across the age distribution of the population. Younger families generally experienced the most volatility, while older families have emerged with the largest net increases in mortgage debt.
The Mortgage Boom Relative to House Values and the Economy
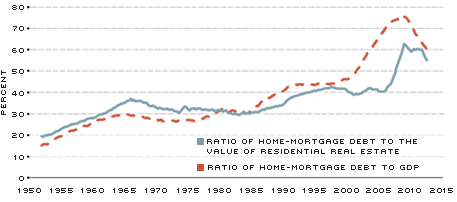
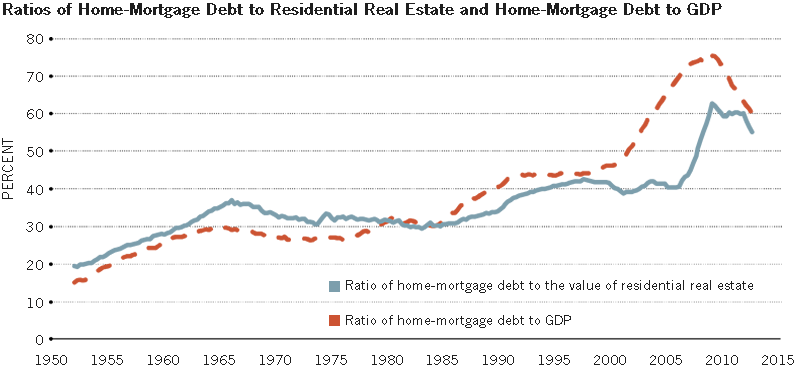
For several decades before the recent recession, home-mortgage debt had increased much more rapidly than both the value of the houses it financed and the overall economy. Since 2008, the amount of mortgage debt outstanding has declined continuously. As a consequence, the ratios of home-mortgage debt to both residential real estate and to gross domestic product (GDP) have fallen significantly—back to their immediate precrisis (2008) and 2003 levels, respectively.1
Total home-mortgage debt increased from $53 billion in the first quarter of 1952—15.1 percent as large as annualized gross domestic product (GDP) at that time—to $9.5 trillion in the third quarter of 2012—60.1 percent as large as annualized GDP.2 This ratio reached its peak during the first quarter of 2009, when home-mortgage debt totaled $10.5 trillion, or 75.5 percent of the level of annualized GDP (Figure 1). Compared with the market value of all residential real estate, home-mortgage debt was 62.7 percent as large at the peak. At the end of the third quarter of 2012, the ratio of home-mortgage debt to the value of residential real estate was 55.2 percent. Both ratios had increased substantially during recent decades and especially during the 2000s. They remained at historically elevated levels in late 2012.
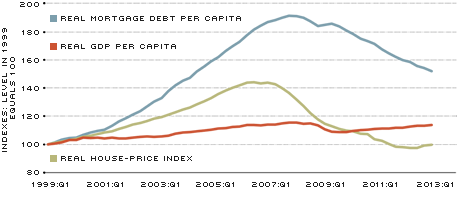
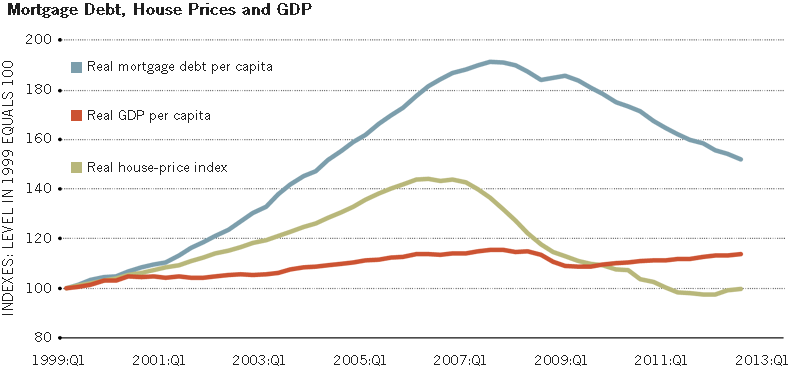
Adjusting for inflation and population growth, the average American family nearly doubled its mortgage debt between 1999 and 2008 (Figure 2). The average house price and the total amount of economic output and income, meanwhile, rose much less. Given the slow-moving and persistent trends shown in Figure 2, it appears likely that mortgage debt will continue to decline for some time—in relation to house prices and GDP, at least, if not in absolute terms.
Ratios of Home-Mortgage Debt to the Value of Residential Real Estate and Home-Mortgage Debt to GDP
SOURCES: Federal Reserve Board, Bureau of Economic Analysis; data through 2012:Q3.
Mortgage Debt, House Prices and GDP
SOURCES: Federal Reserve Board, Federal Housing Finance Agency and Bureau of Economic Analysis; data through 2012:Q.3.
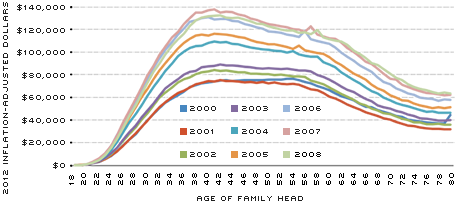
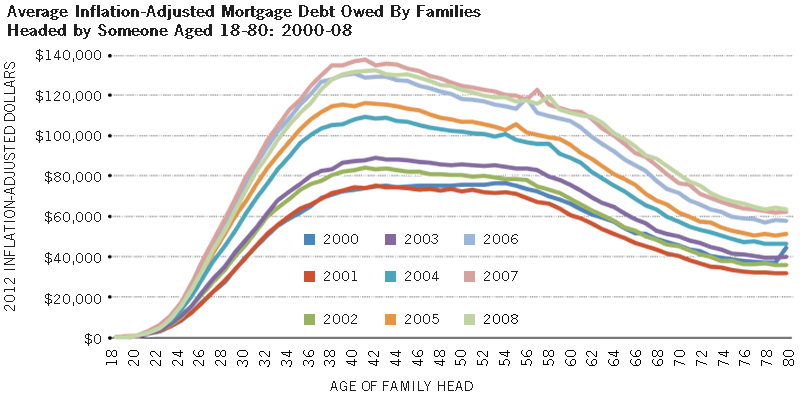
Average Inflation-Adjusted Mortgage Debt Owed by Families
Headed by Someone Aged 18-80: 2000-08
SOURCES: FRBNY Consumer Credit Panel, Equifax.
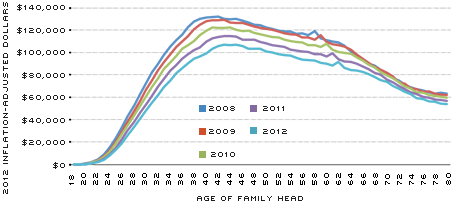
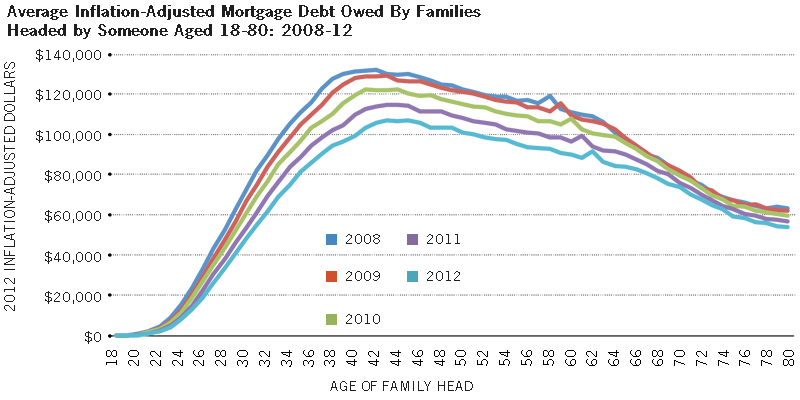
Average Inflation-Adjusted Mortgage Debt Owed by Families
Headed by Someone Aged 18-80: 2008-12
SOURCES: FRBNY Consumer Credit Panel, Equifax.
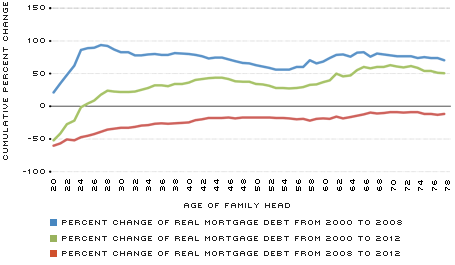
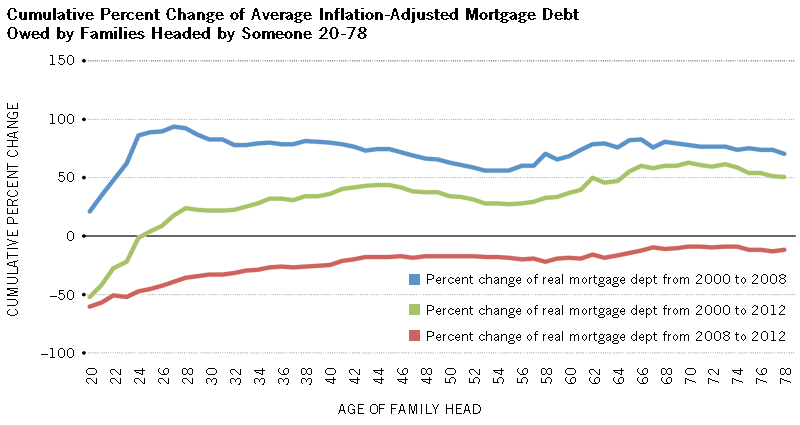
Cumulative Percent Change of Average Inflation-Adjusted Mortgage Debt Owed by Families Headed by Someone 20-78
SOURCES: FRBNY Consumer Credit Panel, Equifax.
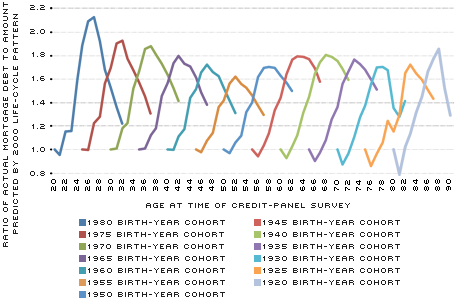
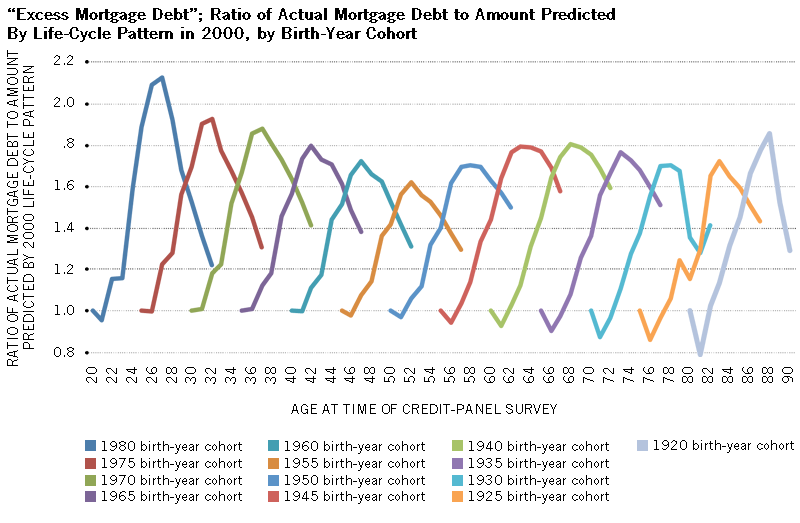
"Excess Mortgage Debt"; Ratio of Actual Mortgage Debt to Amount Predicted by Life-Cycle Pattern in 2000, by Birth-Year Cohort
SOURCES: FRBNY Consumer Credit Panel, Equifax.
NOTE: Each point represents a single annual observation of a birth-year cohort, beginning in 2000; the line connecting the points traces out the evolution of a single birth-year cohort from 2000 to 2012.
Mortgage Debt across the Age Distribution of the Population
Between 2000 and 2008, the average amount of inflation-adjusted mortgage debt owed by an American family increased year by year across virtually the entire age spectrum (Figure 3).3 For example, in 2000, the average amount of mortgage debt was between $73,000 and $77,000 for all family heads between the ages of 40 and 56 (in 2012 dollars). By 2008, family heads in their early 40s had average mortgage balances close to $130,000, while family heads in their mid-50s had balances closer to $120,000. The average mortgage balances of relatively young and relatively old family heads increased less in dollar terms. Hence, the mortgage boom was most pronounced in dollar terms among family heads in the vicinity of 40 years of age.
After 2008, average mortgage balances declined in most age groups each year (Figure 4). The largest dollar declines again were among families headed by someone in their late 30s and early 40s. The dollar declines were somewhat smaller among relatively young and relatively old family heads.
To see which ages experienced the largest percentage increases and decreases in mortgage debt during the boom and bust, we calculated the percentage changes in the average inflation-adjusted home-mortgage debt owed by families at each age (Figure 5). Between 2000 and 2008, there were two prominent features of the distribution of changes. Family heads in their mid-20s had extraordinarily large average increases, almost doubling. Family heads in their 30s and early 40s also increased their average mortgage debt by about 80 percent. At the other end of the age spectrum, family heads aged 60 and over also increased their mortgage debt by about 80 percent. Family heads in their very early 20s and those between about 45 and 60 years old increased their mortgage borrowing noticeably less during the boom.
Figure 5 also shows the percent decline by age of the average inflation-adjusted mortgage debt between 2008 and 2012. The sharpest percentage declines were among the youngest families, dropping in excess of 50 percent. Not coincidentally, the homeownership rate declined sharply among younger age groups during this period, in part due to elevated foreclosure rates.4 The percentage declines in mortgage debt generally were smaller the older the family's head.
Combining the boom and bust periods (that is, from 2000 to 2012), at least two striking results are evident. First, with the exception of a few age groups in the early 20s, the average inflation-adjusted mortgage debt was significantly greater in 2012 than in 2000 for virtually the entire population. Recall from Figure 2 that real house prices and real GDP were essentially unchanged during this period, suggesting that the real burden of debt increased and remains elevated.
Second, the largest net percentage increases in average mortgage debt over the entire period were among families headed by someone 60 or older. Hence, the most lasting impact on average mortgage debt holding appears to have been on the older segment of the population. Homeownership rates have not changed much in this age range; so, the net increase in mortgage borrowing must have been used for other purposes. Older families may have used their home equity increasingly as collateral for loans to finance current spending or other investments.
Being in the Wrong Place at the Wrong Time
The amount of mortgage debt a family has at a given time depends both on where they are in their life cycle and the external circumstances they face (as well as a host of idiosyncratic factors). An increase in the availability of mortgage credit, for example, is likely to matter more for a young first-time home-buying family that, in previous times, would have had more difficulty borrowing compared with a middle-aged family that already has a mortgage. Our data allow us to separate the life-cycle and historical-time-period effects in mortgage borrowing.
We define "excess mortgage debt" as the difference between the average amount of mortgage debt owed by the families of a given age in a given year and the average mortgage debt owed by families of the same age in the base year, which we chose to be 2000. For example, the average amount of mortgage debt owed by families in 2007 that were headed by someone born in 1980 (that is, 27 years old) was $47,623. The average amount of mortgage debt owed by 27-year-old family heads in the base year of 2000 was $22,395. (The figures are adjusted for inflation.) Thus, the excess mortgage debt owed by the 1980 birth-year cohort in 2007 was $25,228. Expressed as a ratio of the actual to the "predicted" amount based on the 2000 life-cycle pattern, the 1980 birth-year cohort had 213 percent of the amount we would have expected if there had been no change in mortgage-market conditions and borrowing behavior between 2000 and 2007. This ratio is a measure of how significant changes in the mortgage market were between 2000 and 2007, controlling for life-cycle factors that also help determine how much mortgage debt a family has.
Figure 6 shows the excess mortgage debt ratio for a selected group of birth-year cohorts in each year from 2000 to 2012. For tractability, we examined only every fifth birth-year cohort between 1920 and 1980. For example, the line furthest to the left in the figure shows the evolution (from left to right) from 2000 to 2012 of the excess mortgage debt ratio for the 1980 birth-year cohort. This ratio reached 2.13 times in 2007, or 213 percent, of the amount predicted by the life-cycle patterns evident in 2000. This is the highest point attained by any line in the figure, which means the mortgage boom affected families born in the vicinity of 1980 more than those in any other era.5 These were families in their mid- to late 20s near the peak of the housing and mortgage boom; so, the increased availability of mortgage credit—and perhaps the great enthusiasm for homeownership—combined with their life stage to induce them to take on unusually large mortgage commitments. The figure also indicates that the life-cycle-adjusted decline in excess mortgage debt after 2007 was larger for the 1980 cohort than for any other (represented by the size of the vertical drop traced out by the last five observations). Thus, the 1980 birth-year cohort experienced the most extreme volatility in its holdings of mortgage debt.
At the other extreme, the 1955 birth-year cohort experienced the smallest increase in excess mortgage debt among those shown in the figure. In general, cohorts born in 1955 or earlier (further to the right in the figure) experienced smaller declines in their excess mortgage debt between 2007 and 2012 than did those born later.
Conclusions
The extraordinary boom and bust in home-mortgage borrowing between 2000 and 2012 did not occur uniformly across the age distribution of the population. In inflation-adjusted dollar terms, the largest increases between 2000 and 2008 in average mortgage debt per family occurred among families headed by people in their late 30s or early 40s. In percentage terms, the largest increases between 2000 and 2008 were among families headed by people in their mid- to late 20s. The smallest percentage increases—although still sizable—were seen among families headed by people in their mid-50s.
As average mortgage balances have declined after the financial crisis, the patterns noted above largely were followed in reverse. The largest inflation-adjusted dollar declines between 2008 and 2012 were among families in their mid-30s, while the largest percentage declines were among families in their 20s. Tracking birth-year cohorts through the years between 2000 and 2012, families headed by someone born in 1980 or 1981 experienced both the largest percentage increase in average mortgage debt through 2007, relative to what we would have expected based on life-cycle patterns in 2000, as well as the largest subsequent percentage decrease through 2012. Cohorts that were in their late 20s as the mortgage boom reached its apogee were most affected by it and the subsequent bust.6
Meanwhile, the largest net percentage increases in average mortgage debt from the beginning of the boom in 2000 to the present day typically were among families in their 60s and 70s. In terms of birth-year cohorts, the families that experienced the largest net percentage increases in inflation-adjusted mortgage debt relative to what one would have expected based on the life-cycle patterns evident in 2000 were those born in 1950 and earlier.
Thus, the mortgage boom and bust have had profoundly different effects on different age groups and birth-year cohorts. Younger families generally experienced the most volatility, while older families have emerged with the largest net increases in mortgage debt in percentage terms.
Endnotes
- Federal Reserve Board and Bureau of Economic Analysis. Data are quarterly through Sept. 30, 2012. [back to text]
- Federal Reserve Board and Bureau of Economic Analysis. [back to text]
- Data are from the Consumer Credit Panel produced by Equifax for the Federal Reserve Bank of New York. This statement does not mean that specific families experienced the changes described here. We are comparing the average mortgage debt of families of a certain age at one point in time with the average mortgage debt of families of that same age at a different point in time. We describe cohort effects—that is, tracking a group of families born in a given year through time—in discussions below. [back to text]
- Emmons and Noeth document sharp declines in the homeownership rates and average net worth of young families. Emmons et al. find that young families experienced unusually high rates of foreclosure near the turning point of the mortgage boom in 2008. [back to text]
- When we examine every single birth-year cohort between 1920 and 1993, the largest ratio of actual-to-predicted mortgage debt occurs in the 1981 birth-year cohort in 2007. It is only marginally larger than that of the 1980 cohort—216 percent vs. 213 percent; so, we focus on the 1980 cohort for ease of exposition. [back to text]
- See Emmons and Noeth for a more detailed discussion of young homeowners before and after the financial crisis. [back to text]
References
Bureau of Economic Analysis. Gross Domestic Product. See www.bea.gov/national/index.htm#gdp
Emmons, William; Fogel, Kathy; Lee, Wayne; Rorie, Deena; Ma, Liping; and Yeager, Timothy. "The Foreclosure Crisis in 2008: Predatory Lending or Overreaching?" Federal Reserve Bank of St. Louis The Regional Economist, Vol. 19, No. 3, July 2011, pp. 12-15.
Emmons, William; and Noeth, Bryan. "Why Did Young Families Lose So Much Wealth During the Crisis? The Role of Homeownership," Federal Reserve Bank of St. Louis Review, Vol. 95, No. 1, January/February 2013, pp. 1-26.
Federal Reserve Bank of New York. Equifax Consumer Credit Panel. See www.newyorkfed.org/householdcredit/index.html
Federal Reserve Board. Flow of Funds Accounts. See www.federalreserve.gov/releases/z1/


Views expressed in Regional Economist are not necessarily those of the St. Louis Fed or Federal Reserve System.
For the latest insights from our economists and other St. Louis Fed experts, visit On the Economy and subscribe.
Email Us