


Household Financial Stress and Home Prices
The financial stress faced by U.S. households began to deteriorate quickly with the onset of the financial crisis in 2007-2008. By some measures, this deterioration continued unabated well into 2010, after which a gradual recovery began.
A common measure of financial stress is the serious delinquency (SD) rate. This measures the proportion of consumer debt balances that is at least 90 days delinquent.1
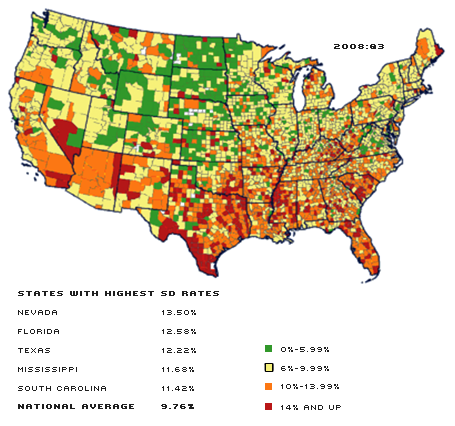
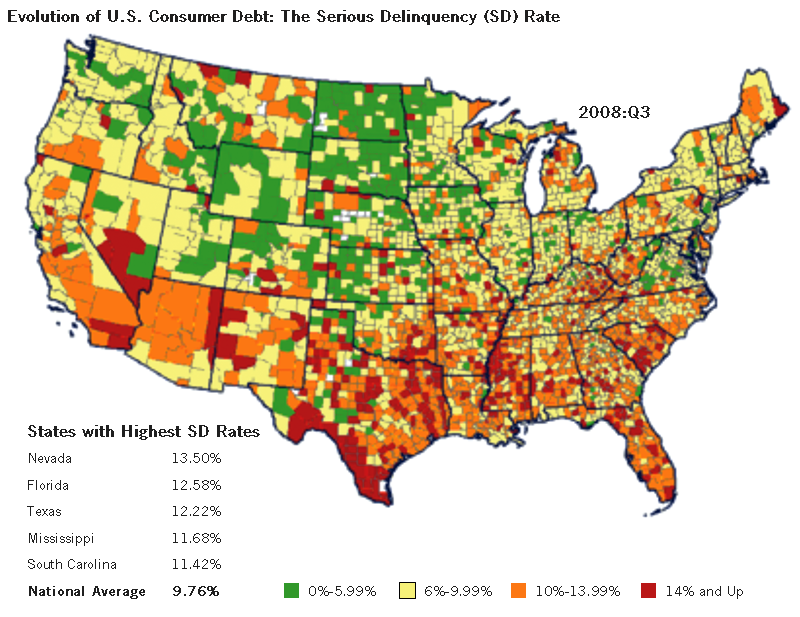
Figure 1 displays the SD rates for the continental U.S. for the years 2008, 2010 and 2012. In the third quarter of 2008, the national SD rate was 9.76 percent.2 The states with the lowest SD rates were North Dakota (5.05 percent), Wyoming (6.35 percent), South Dakota (6.52 percent), Washington (6.60 percent) and Utah (6.79 percent). The states with the highest rates were Nevada (13.50 percent), Florida (12.58 percent), Texas (12.22 percent), Mississippi (11.68 percent) and South Carolina (11.42 percent). Overall, 12 out of 49 states had SD rates higher than 10 percent.
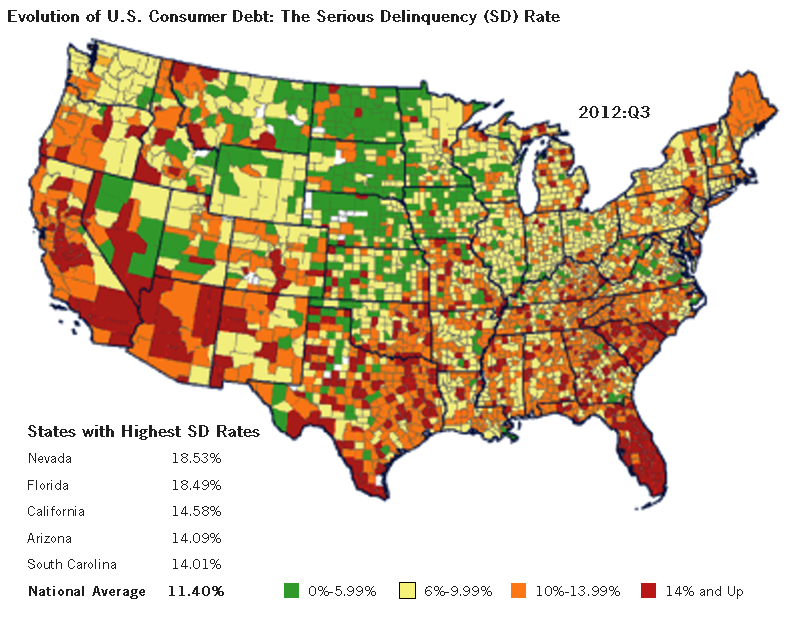
Evolution of U.S. Consumer Debt: The Serious Delinquency (SD) Rate
SOURCE: Federal Reserve Bank of New York Consumer Credit Panel/Equifax.
NOTE: "Serious delinquency" refers to consumer debt that is at least 90 days past due.
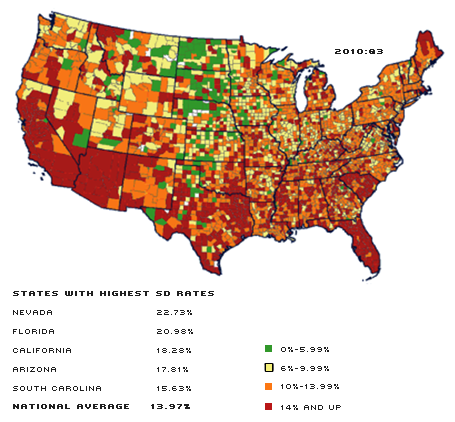
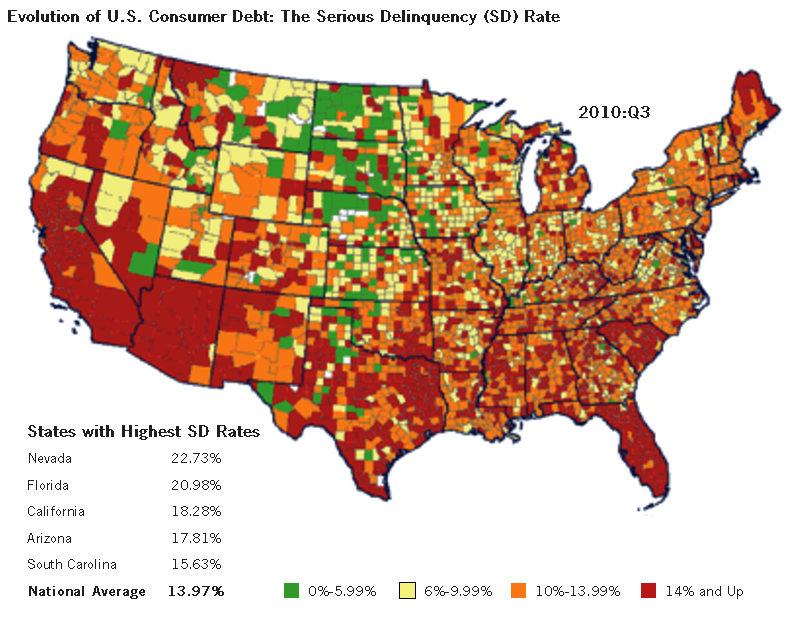
The consumer credit market reached its highest levels of distress in 2010:Q3, when the national SD rate peaked at 13.97 percent. The best SD rates were in North Dakota (7.85 percent), the District of Columbia (8.84 percent), Nebraska (9.07 percent), Wyoming (9.43 percent) and Kansas (9.58 percent). The worst rates were in Nevada (22.73 percent), Florida (20.98 percent), California (18.28 percent), Arizona (17.81 percent) and South Carolina (15.63 percent). Of the 49 states, 33 had SD rates between 10 percent and 14 percent, and eight states had SD rates above 14 percent.
The addition of Arizona and California to the group of states with the worst SD rates, which already included Nevada and Florida, shows the important role played by the housing bust in exacerbating financial distress across U.S. households. There is significant evidence to suggest that the rapid increase in home prices in these states allowed households to extract home equity loans. To the extent these loans were used to pay off other forms of debt, they may have kept household distress levels in check. Needless to say, this source of funds dried up with the steep decline in house prices.
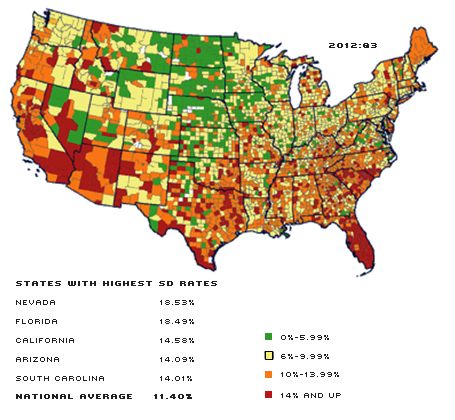
As of 2012:Q3, the national SD rate had declined moderately to 11.40 percent. The states with the lowest SD rates then were North Dakota (4.69 percent), Nebraska (6.45 percent), South Dakota (6.79 percent), Iowa (7.20 percent) and Wisconsin (7.24 percent). The states with the highest SD rates were Nevada (18.53 percent), Florida (18.49 percent), California (14.58 percent), Arizona (14.09 percent) and South Carolina (14.01 percent). Again, the number of states with SD rates between 10 percent and 14 percent fell, from 33 in 2010:Q3 to 21 in 2012:Q3; only five states have SD rates above 14 percent. These data also provide support for the hypothesis that deleveraging by households is a slow and lengthy process.
In all 49 states, the 2012:Q3 SD rates were lower than their 2010:Q3 levels; in eight of the 49 states, the 2012:Q3 SD rates were lower than their 2008:Q3 levels. The trend shows an unambiguous improvement in household credit conditions.
Bankruptcy Filings
Another indicator of household-level financial conditions is household bankruptcy filings. The common form of (nonbusiness) bankruptcy filings occurs under two procedures: Chapter 7 (liquidation) and Chapter 13 (reorganization and rescheduling of debt repayment).3 In 2008, the national Chapter 7 filing rate was 1.95 per 1,000 population, and the Chapter 13 filing rate was 1.12. As economic conditions worsened, Chapter 7 filing rates increased to 2.84 in 2009 and to 3.53 in 2010; Chapter 13 filing rates increased to 1.24 in 2009 and 1.36 in 2010. In 2011, the Chapter 7 filing rate dropped to 3.36 but the Chapter 13 filing rate continued to increase slightly, to 1.37.
There is significant geographic variation in bankruptcy filing rates. For example, in 2008, the 10 metropolitan statistical areas (MSAs) with the lowest Chapter 7 filing rates were all in North Carolina, South Carolina and Texas. Meanwhile, six of the 10 MSAs with the highest Chapter 7 filing rates were in Indiana; the other four MSAs were in Arkansas, Michigan, Nevada and Ohio. In 2011, all 10 MSAs with the lowest Chapter 7 filing rates were still in North Carolina, South Carolina and Texas;4 their filing rates were somewhat lower than in 2008. In contrast, the 10 MSAs with the highest Chapter 7 filing rates were spread across seven states; their rates were mostly higher than in 2008.
The MSA-level Chapter 13 filing trends are also worth mentioning. In 2008, the 10 MSAs with the lowest Chapter 13 filing rates were spread across seven states. But the 10 MSAs with the highest Chapter 13 filing rates were all located in Southern states, namely, Alabama, Arkansas, Georgia, Louisiana, Mississippi and Tennessee. Similarly, in 2011, the 10 MSAs with the lowest Chapter 13 filing rates were spread across 10 states; their rates were mostly higher than in 2008. The 10 MSAs with the highest Chapter 13 filing rates were all located in the same Southern states; their rates were mostly lower than in 2008, however.
The Role of House Price Changes
Given the variation in bankruptcy filings across MSAs, it would be interesting to know how house price changes correlate with financial distress.5 For example, one would guess that regions where house prices are appreciating would be more likely to witness low rates of bankruptcy filings. Conversely, regions with a steep decline in house prices would witness higher filing rates.
We compared 2008 bankruptcy rates with 2000-2008 housing price changes and compared 2011 bankruptcy rates with 2008-2011 housing price trends. We found no clear pattern between Chapter 13 bankruptcy rates and housing prices; however, there is a significant inverse correlation between Chapter 7 filing rates and housing price changes. (See Table 1.) For the 10 MSAs with the lowest Chapter 7 filing rates in 2008, housing prices increased 58 percent between 2000 and 2008; the 10 MSAs with the highest Chapter 7 rates in 2008 experienced a 26 percent housing price increase. Clearly, the Las Vegas-Paradise MSA shows anomalous behavior: a significantly high filing rate alongside some of the highest appreciation of home prices in recent history.
In a similar fashion, the 2008-2011 housing price trends are correlated to differences in 2011 Chapter 7 filing rates. The 10 MSAs with the lowest Chapter 7 rates in 2011 had a 2 percent drop in housing prices between 2008 and 2011; the 10 MSAs with the highest Chapter 7 rates suffered a 29 percent drop in housing prices. Obviously, higher Chapter 7 bankruptcy filing rates are associated with deeper housing price declines. However, this does not imply causation. Here, too, there are exceptions to this behavior: The Wilmington MSA in North Carolina witnessed a significantly large decline in home prices without a concomitant increase in bankruptcy rates. These results seem to suggest that home price changes have a strong association with the financial condition of the household—however, further research is needed to better understand the degree and nature of this association.
Endnotes
- See Liu and Sengupta. [back to text]
- This article analyzes only the 48 states in the continental U.S. and the District of Columbia (D.C.), which is considered a state in this case. [back to text]
- A brief discussion and comparison of bankruptcy under Chapter 7 and Chapter 13 can be found in Li and White (2011). [back to text]
- 2011 data are the most recent observations. It is important to note that under the 2005 bankruptcy law, filings under Chapter 7 are means-tested using state median incomes. Therefore, filing rates in a given MSA could be higher depending on how the incomes of individuals in the MSA compare with those in the state. [back to text]
- See Li. [back to text]
References
Li, Wenli. "Residential Housing and Personal Bankruptcy." Federal Reserve Bank of Philadelphia Business Review, 2009 Q2, pp. 19-29.
Li, Wenli; and White, Michelle. "Did Bankruptcy Reform Cause Mortgage Defaults To Rise?" American Economic Journal: Economic Policy, November 2011, Vol. 3, No. 4, pp. 123-47.
Liu, Yang; and Sengupta, Rajdeep. "Household Financial Stress Declines in the Eighth District." The Federal Reserve Bank of St. Louis' The Regional Economist, October 2012, Vol. 20, No. 4, pp. 20-21.
Views expressed in Regional Economist are not necessarily those of the St. Louis Fed or Federal Reserve System.
For the latest insights from our economists and other St. Louis Fed experts, visit On the Economy and subscribe.
Email Us