


On the Road to Recovery, Soft Patches Turn Up Often
During mid-2009, the U.S. economy exited the economic contraction that began year-end 2007 and entered into an economic recovery phase.1 Approximately two-and-a-half years later, both real GDP and consumer expenditures surpassed their prerecession peaks, although industrial production remained weak and the unemployment rate exceeded 8.5 percent.2
During the recovery, as in many previous recoveries, analysts spoke of "soft spots" or "soft patches," that is, periods when slower growth raised concern that economic activity might turn downward before reaching its previous peak, a so-called double-dip recession. The terms "soft spot" and "soft patch" are found in Federal Reserve publications as early as the Board of Governors' Annual Report for 1948 and, more recently, in publications as varied as the Board of Governors' semiannual Monetary Policy Report to the Congress, speeches by Federal Reserve officials and transcripts of Federal Open Market Committee meetings. The terms also frequently appear in the popular press. Unfortunately, despite widespread usage, there is no accepted definition of a soft patch.
A Look at Five Business Cycles
Rebounds in economic activity, when measured by growth of real GDP, are seldom smooth; temporary slowdowns are commonplace. These slowdowns, or soft patches, do not reliably foreshadow peaks in economic activity: During the past 60 years, there have been far more soft patches than business cycle peaks. Yet, fear is not baseless: All business cycle peaks since 1950 have been preceded by soft patches.
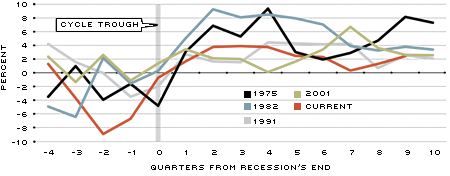
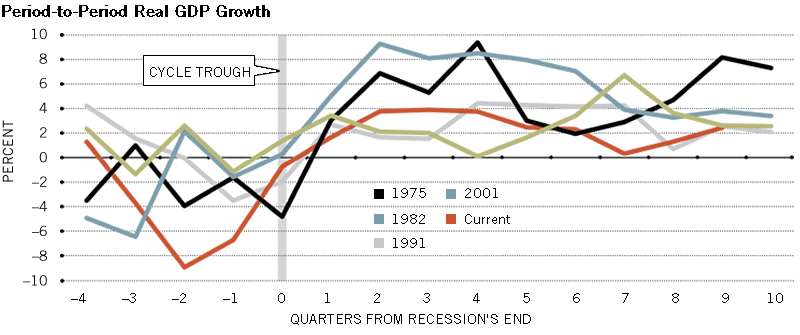
Figure 1
Period-to-Period Real GDP Growth
SOURCES: Bureau of Economic Analysis and authors' calculation.
The paces of recovery following five recent business cycle troughs are shown in the figure. It shows the quarterly (that is, quarter-to-quarter) growth rate of real GDP, which is choppy in both business cycle expansions and contractions. Recoveries following cycle troughs in 1975, 1982 and 2007 (the current recovery) displayed initial strong growth, followed by slowing after five quarters. Recoveries following troughs in 1991 and 2001 were shallow, and subsequent recoveries were milder. During the first three years of the five recoveries, temporary slowdowns lasting two consecutive quarters occurred 22 times and slowdowns of three consecutive quarters happened 17 times. None of these slowdowns foreshadowed a business cycle peak in the near term (although, of course, peaks eventually did occur).
Absent a widely accepted definition of a soft patch, we examined two possibilities:
(1) A soft patch occurs when the GDP growth rate during the current quarter and the immediately prior quarter (that is, the two most recent quarters) is less than during the quarter that preceded these two quarters (a two-quarter soft patch); and
(2) A soft patch occurs when the GDP growth rate during the current quarter and the two immediately prior quarters is less than during the quarter that preceded these three quarters (a three-quarter soft patch).
We examined the 11 business cycle expansions that have occurred since 1950. (Dates of the expansions are shown in Table 1.) The 10 expansions prior to the current expansion averaged 20.1 quarters in duration; the briefest was four quarters, and the longest lasted 40 quarters.
Table 2 summarizes the analysis. Since 1950, during National Bureau of Economic Research (NBER) business cycle expansions, there have been 69 and 52 instances, respectively, of two- and three-quarter slowdowns (column 1). The frequency of soft patches overpredicts the frequency of business cycle peaks—there have been only 10 business cycle peaks.3 Yet, since 1950, every business cycle peak has been closely preceded by a soft patch. With respect to two-quarter soft patches, six business cycle peaks occurred during the final quarter of two-quarter soft patches (column 2, first row), and four occurred during the following quarter (column 3, first row); note that the 1973:Q4 peak was preceded uniquely by both two- and three-quarter soft patches.
With respect to three-quarter soft patches, four peaks occurred during the final quarter of a three-quarter soft patch (column 2, second row), and one occurred immediately after a three-quarter soft patch (column 3, second row). On average, two- and three-quarter soft patches have preceded the last 10 business cycle peaks by 12.5 and 12.7 quarters, respectively.
Nothing Hard and Fast about Soft Patches
In brief, we find that soft patches—that is, slowdowns of real GDP growth lasting two or three quarters—are commonplace during economic expansions. Such slowdowns, however, are not reliable predictors of subsequent business cycle peaks (the start of recessions) despite approximately half of peak quarters being immediately preceded by a soft patch. Soft patches are far more numerous than cycle peaks, and the timing between soft patches and cycle peaks is imprecise. Fluctuations in GDP growth are common during economic recoveries, and soft spots do not necessarily foreshadow further slowing.
Endnotes
- See Contessi and El-Ghazaly. [back to text]
- See Eaton et al. [back to text]
- See Chor and Manova. [back to text]
- See Hummels and Schaur. [back to text]
- See Auboin. [back to text]
- Bank trade finance is based on idiosyncratic relationships with specific clients so that its availability and even its cost depend on a complicated relationship among client, counterparty and counterparty banks. As there is much proprietary information about bank-client relationships, this information is rarely disclosed. [back to text]
- See Manova. [back to text]
- See Berman and Héricourt. [back to text]
- BAFT-IFSA is the global financial services association formed by the merger of the Bankers' Association for Finance and Trade (BAFT) and the International Financial Services Association (IFSA). [back to text]
- See Asmondson et al. [back to text]
References
Amiti, Mary; and Weinstein, David E. "Exports and Financial Shocks." National Bureau of Economic Research Working Paper No. 15556, December 2009.
Asmondson, Irena; Dorsey, Thomas; Khachatryan, Armine; Niculcea, Ioana; and Saito, Mika. "Trade and Trade Finance in the 2008-09 Financial Crisis." International Monetary Fund Working Paper 11/16, January 2011.
Auboin, Marc. "Restoring Trade Finance during a Period of Financial Crisis: Stock-Taking of Recent Initiatives." WTO Staff Working Paper ERSD-2009-16, December 2009.
Berman, Nicolas; and Héricourt, Jérôme. "Financial Factors and the Margins of Trade: Evidence from Cross-Country Firm-level Data." Journal of Development Economics, November 2010, Vol. 93, No. 2, pp. 206-17.
Chor, Davin; and Manova, Kalina. "Off the Cliff and Back? Credit Conditions and International Trade during the Global Financial Crisis." Journal of International Economics, forthcoming in 2012.
Contessi, Silvio; and El-Ghazaly, Hoda S. "The Trade Collapse: Lining Up the Suspects." The Federal Reserve Bank of St. Louis' The Regional Economist, April 2010, Vol. 18, No. 2, pp. 10-11.
Eaton, Jonathan; Kortum, Samuel; Neiman, Brent; and Romalis, John. "Trade and the Global Recession." NBER Working Paper No. 16666, January 2011.
Hummels, David L.; and Schaur, Georg. "Hedging Price Volatility Using Fast Transport." Journal of International Economics, September 2010, Vol. 82, No. 1, pp. 15-25.
Manova, Kalina. "Credit Constraints, Equity Market Liberalizations, and International Trade." Journal of International Economics, September 2008, Vol. 76, No. 1, pp. 33-47.
Views expressed in Regional Economist are not necessarily those of the St. Louis Fed or Federal Reserve System.
For the latest insights from our economists and other St. Louis Fed experts, visit On the Economy and subscribe.
Email Us