


District Overview: Local Housing Crisis Is Similar to Nation's
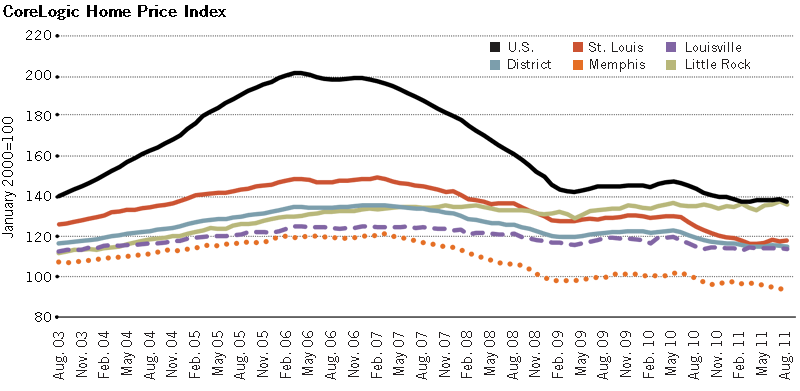
The housing crisis has been milder in the Eighth District than in the nation, but since early 2009 house prices in the District and nation, as measured by the CoreLogic Home Price Index (HPI), have followed a similar pattern. As Figure 1 shows, the boom in house prices before 2007 and the bust afterward were milder in the District than in the nation. The house prices in the District had a modest upward trend and peaked in February 2007; in the nation, house prices increased at an accelerated rate and peaked in March 2006. Once the housing bubble burst, prices in the District decreased by 11.8 percent in the two years from peak to trough; nationwide, house prices started to drop in 2007 and reached their first trough 37 months after the peak, falling 29.4 percent along the way.
CoreLogic Home Price Index
SOURCE: Authors' calculations based on data provided by CoreLogic.
NOTE: Aggregate house price index for the Eighth District is calculated as the average of the house price indexes of all 18 MSAs covered in the District, weighted by population.
Starting in February 2010, both sets of prices rose for about six months but at a slower pace (about 2 percent year-over-year growth rates) than during the bubble days. This reversal in price change was short-lived; house prices soon decreased again. Since May 2011, both sets of house prices have declined at relatively lower rates, which indicates evidence of a possible recovery.
In the District's Four Major MSAs
Within the District, there have been notable variations in house prices. As shown in Figure 1, the house prices in Little Rock were much less volatile than those in the other major metropolitan statistical areas (MSAs)—Louisville, Memphis and St. Louis. Little Rock's growth rate remained positive until May 2008, which was 10 months after the District's house prices experienced negative growth rates. Moreover, the decline in Little Rock lasted only 14 months and the largest year-over-year decrease was 4.1 percent, compared with a decline of 28 months and biggest drop of 7.9 percent in the District. The house prices in Little Rock have generally stayed on a modest upward trend after June 2009. As of August 2011, Little Rock's average growth rate in 2011 was 0.1 percent.
Although the house prices in the rest of the major MSAs have closely followed the trend of District prices since the last recession started, there have been exceptions. Memphis experienced the deepest decline. From their peak in March 2007 to their trough in February 2009, house prices in Memphis decreased by 19.6 percent, 7.7 percentage points greater than the District's rate of decline over the same period. Before the second downturn, which started in the second quarter of 2010, house prices in St. Louis had a similar pattern as prices for the District overall. But the St. Louis prices then experienced the deepest decline among the four major District MSAs, 10.3 percent, 3.9 percentage points worse than the District average over the same period.
What Might Have Driven House Prices?
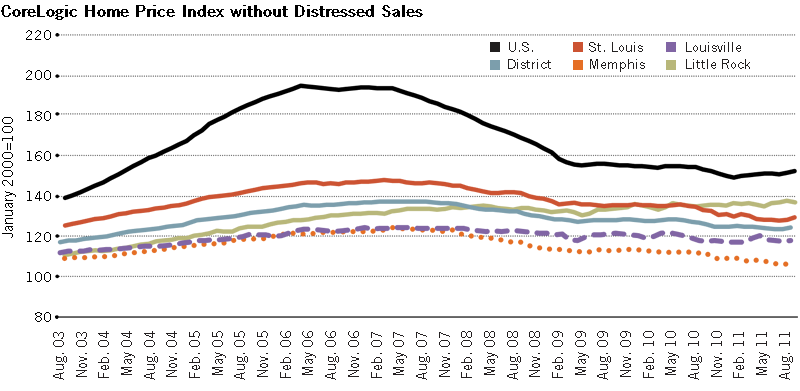
One important factor in the housing crisis has been the increase in distressed sales (defined as real-estate-owned and short transactions by the CoreLogic HPI). Figure 2
shows house prices without distressed sales. To infer the impact of distressed sales on overall house prices, one can compare the change in the index that includes distressed sales with the change in the index that excludes those sales. For example, from March 2006 to April 2009, while the national house prices including distressed sales (as seen in Figure 1) declined 29.4 percent, house prices excluding distressed sales decreased 20.3 percent. The difference of 9.1 percentage points can be attributed to distressed sales.
CoreLogic Home Price Index without Distressed Sales
SOURCE: Authors' calculations based on data provided by CoreLogic.
NOTE: Aggregate house price index for the Eighth District is calculated as the average of the house price indexes of all 18 MSAs covered in the District, weighted by population.
Before 2007, the effect of distressed sales on house prices in both the nation and the District was moderate. Distressed sales added less than two percentage points to
the growth rates of national house prices during the boom and even made a negative
contribution to that of the District for most of this time (–0.2 percent on average). During the housing bust, however, prices in both the nation and the District were largely driven by distressed sales. By including distressed sales in the house prices, the peak of year-over-year decline rate in the nation increased from 11.9 percent to 18.1 percent during the first downturn of house prices; in the District, the decline rate peak increased 2.9 percentage points to 7.9 percent.
Surprisingly, during the short "recovery" in the first half of 2010, house prices in both the nation and the District declined after excluding distressed sales. The positive growth rates that appeared in 2010 were mainly driven by distressed sales. In July 2010, distressed sales once again drove the house prices in the other direction, leading to the second downturn.
The effect of distressed sales on house prices is similar across all four major MSAs in the District. However, the impact has been more severe in Memphis and St. Louis.
Specifically, distressed sales reduced year-over-year growth in house prices between January 2007 and August 2011 by an average of 2 percent in these two MSAs, compared with 0.9 percent in Louisville and 0.4 percent in Little Rock.
Conclusion
Since July 2010, house prices have decreased in the District, including all of the major MSAs except for Little Rock. The average monthly year-over-year change in house prices between January 2011 and August 2011 was –5.2 percent in the District, –8.8 percent in St. Louis, –5.0 percent in Memphis, –3.4 percent in Louisville and 0.1 percent in Little Rock. If distressed sales were excluded, the decline rates would be less than half of the above numbers. One possible explanation for the persistent decrease of house prices is that the number of home sales has decreased. According to the Eighth District's Beige Book of Oct. 19, August 2011 year-to-date home sales continued to decline throughout the District compared with the same time period a year earlier. The number of home sales in the four District regions experienced an average decline of 9 percent in the first eighth months of 2011 compared with the same period in 2010.
References
The Beige Book (formally known as the Summary of Commentary on Current Economic Conditions by Federal Reserve District). Oct. 19, 2011. See www.federalreserve.gov/FOMC/BeigeBook/2011/20111019/default.htm
Views expressed in Regional Economist are not necessarily those of the St. Louis Fed or Federal Reserve System.
For the latest insights from our economists and other St. Louis Fed experts, visit On the Economy and subscribe.
Email Us