


Inflation May Be the Next Dragon To Slay
By most metrics, the recent recession was the longest and deepest since the 1930s. Some analysts believe that the Federal Reserve's and the federal government's aggressive actions to assist and stabilize the economy and fragile credit markets prevented an even worse outcome than actually occurred. Now, with economic and financial conditions on the mend, many analysts are turning their attention to the legacy of these actions.
Foremost among the concerns of many is how to design a strategy that does not on the one hand raise interest rates prematurely, thereby prematurely nipping the economic recovery in the bud, while on the other hand does not keep rates too low for too long, thereby creating conditions that lead to a surge in inflation or inflation expectations. What's needed is an effective policy to prevent the unprecedented monetary stimulus from becoming a destabilizing influence on price stability. Another key is accurately predicting inflation over the next few years.
Some analysts believe that inflation will remain low as long as the unemployment rate stays well above its natural rate of unemployment (a measure of slack). Others, by contrast, believe that the risk of higher inflation has risen sharply because of the Fed's large-scale asset purchase program and the advent of large, and possibly protracted, budget deficits.
Recent Policy Actions
In some ways, the 2007-09 recession was the most severe since the 1930s. The latest recession lasted probably a little less than two years, roughly double the length of the average post-World War II recession (10 months).1 As yet, though, the unemployment rate remains below its post-World War II peak of 10.8 percent, which was reached in November and December 1982.
Given the severity of the latest recession, it was not surprising that government policymakers were aggressive and innovative in their response to it. Figure 1 shows two key measures of the response taken by Federal Reserve policymakers during this period.
In Figure 1, the path of the FOMC's federal funds interest rate target is plotted along with the monetary base. The monetary base, which is sometimes called "high-powered money," can be thought of as the raw material for creating money.2 Since both series are denominated differently, the chart indexes the series to be 1.0 in January 2007. The chart also includes vertical lines at August 2007, March 2008 and September 2008, when key events occurred in the financial crises.
The FOMC'S Federal Funds Target Rate and the Monetary Base
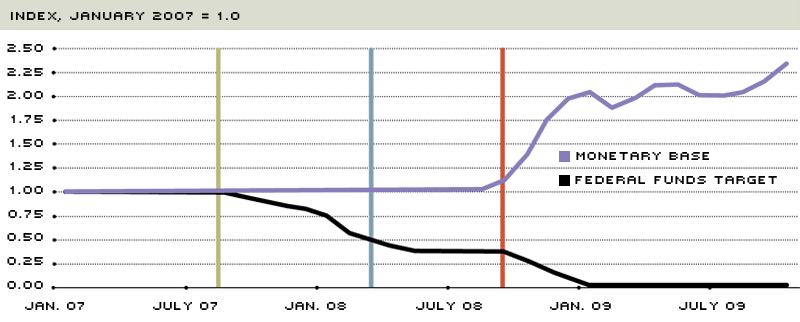
NOTE: Vertical lines mark key times in the financial crisis: August 2007, March 2008 and September 2008.
SOURCE: Author's calculations using Federal Reserve data.
Two key points are worth noting. First, the Fed began reducing its federal funds rate in September 2007, about a month after conditions began to deteriorate in the short-term money markets. Although the FOMC continued to reduce its interest rate target before and shortly after the crisis of Bear Stearns in March 2008, the target then remained on hold from May to September, as rising oil and gasoline prices pushed up headline inflation to levels not seen since early 1991. In September 2008, though, economic and financial conditions deteriorated sharply, causing the Fed to quickly reduce its interest rate target to nearly 0 percent (technically, a range from 0 to 0.25 percent).
The second takeaway from Figure 1 is that the Federal Reserve did not begin to aggressively expand the monetary base until September 2008.3 Prior to then, the Federal Reserve was aggressively lending to domestic and foreign banks and financial institutions, but at the same time it was countering this expansion in bank reserves through offsetting sales of Treasury securities in its portfolio. This is known as sterilization because it prevents an increase in the monetary base.
The Fed's sterilization efforts ended in September 2008, when financial markets experienced considerable disruption associated with the government's takeover of Fannie Mae and Freddie Mac, the failure of Lehman Brothers and the near failure of American International Group (AIG). At that point, more than any other in the crisis, economic activity began to decline sharply and rapidly. By August 2009, the monetary base had risen to a level that was slightly more than double its level in January 2007, while the FOMC had reduced its federal funds target rate by nearly 100 percent. Despite a doubling in the stock of high-powered money, the M2 measure of the money supply increased by only 17 percent over the same period.4
The surge in the monetary base has not increased the money supply to the same extent both because the demand for loans has been weak and because some banks have been reluctant to extend credit. On the demand side, loan growth has been anemic because the demand for credit typically weakens during a recession—especially during a long and deep recession. On the supply side, many banks have become more circumspect in their lending practices in the aftermath of the financial boom and bust. The latter could also reflect the concerns of bank regulators, who are charged with ensuring the safety and soundness of the banking system, and could stem from banking laws that require banks to meet minimum capital requirements.
The Best Way To Forecast Inflation?
Figure 1 shows the primary reason why many economists and financial market participants worry about the potential for much higher inflation rates going forward: The monetary stimulus will eventually lead to a rebound in economic activity and an increase in the demand for bank loans and, thus, faster growth of the money supply. As price pressures begin to build during the recovery—in part because firms find it easier to raise prices and they must compete for labor, capital and materials—inflation and the inflation expectations of firms and households may begin to increase. These inflation expectations may be exacerbated if markets believe that the Fed is not withdrawing the monetary stimulus in a timely fashion, thereby leading to higher future inflation rates.
A considerable amount of disagreement seems to exist among economists about the inflation outlook over the next few years. Some economists are quite worried about the potential for much higher inflation, while others are more concerned about the potential risk of inflation falling to uncomfortably low levels—or even the possibility of deflation (a fall in the aggregate price level). Much of this disagreement reflects, on the one hand, the Federal Reserve's aggressive response to the deep recession, the financial crisis and the exceptionally large federal budget deficits, and on the other hand, the downward pressure on wages and prices that typically occurs in the aftermath of a deep recession.
Figure 2 depicts one way to gauge this disagreement. In Figure 2, the history of the Blue Chip forecasts of the average Consumer Price Index (CPI) inflation rate over the next five years is presented. The chart shows the average of the least optimistic inflation forecasts and the most optimistic inflation forecasts, as well as their difference (disagreement). During periods when inflation tends to be relatively high and variable, such as the late-1980s and early 1990s, there tend to be some sizable differences among forecasters about the medium-term inflation outlook. By contrast, during periods when inflation tends to be relatively low and stable, such
as the mid-1990s to mid-2000s, forecasters tend to disagree less about the inflation
outlook. Since early 2007, though, the level of inflation disagreement among forecasters has increased.
Measuring Disagreement among Forecasters about the View of CPI Inflation over the Next Five Years
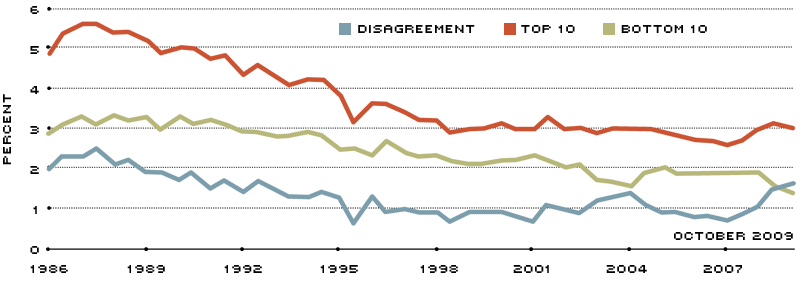
NOTE: Disagreement is measured as the difference between the least optimistic forecasters (top 10 average) and the most optimistic forecasters (bottom 10 average).
SOURCE: Blue Chip Economic Indicators, various issues
Ultimately, one's view of the inflation outlook over the next few years depends on one's view of how best to forecast inflation over that horizon. Economists use numerous methods to forecast inflation. Some economists believe that the growth rate of the money supply is an accurate predictor of inflation. According to this view, popularized by monetarists, the inflation rate will ultimately be determined by the growth rate of the money supply relative to the growth rate of real GDP. When money growth exceeds real GDP growth—what Milton Friedman and others have commonly denoted as too much money chasing too few goods—the inflation rate will increase. To other economists, the inflation process is a random walk, which simply means that today's inflation will be tomorrow's inflation. Thus, if inflation is 1 percent in 2009, then the best forecast for inflation in 2010 is 1 percent. This view has been shown to produce fairly accurate forecasts.5
According to an August 2009 survey, nearly two-thirds of professional forecasters surveyed by the Federal Reserve Bank of Philadelphia use some variant of the Phillips Curve to forecast inflation. The Phillips Curve is now often known as the New Keynesian model. In this view, today's inflation rate depends on (i) the inflation rate expected over some horizon and (ii) the amount of slack in the economy. The amount of slack is also often measured as the difference between actual real GDP and an estimate of potential real GDP; this is termed the output gap. This view also seems to hold sway among several members of the Federal Open Market Committee.
As discussed by St. Louis Fed President James Bullard, the New Keynesian model has a few well-known problems as it relates to forecasting inflation.6 One problem is that the output gap is often subject to considerable measurement error, as well as being revised often because of revisions to real GDP and to estimates of the economy's underlying rate of productivity growth. The latter affects estimates of potential real GDP and, thus, the output gap. As a result, policymakers are often confronted with considerable uncertainty about the size of the gap as they deliberate the stance of monetary policy.
Many New Keynesian economists assume that the output gap matters more than the expected inflation rate for determining today's inflation. That assumption has been questioned by some economists, who instead believe that the public's expectation of future inflation, in part determined by actions of the Federal Reserve, matter more than the degree of economic slack currently in the economy.7
Potential Inflation Risks
Despite some disagreement about the inflation outlook over the next few years, the inflation risks stemming from the government's policy responses to the financial crisis and the so-called Great Recession will probably not be immediately known because the economy is regularly hit by unforeseen shocks (such as large increases in oil prices), foreign economic developments and the legacy of past policy actions. Still, there are several potential risks to the medium-term inflation outlook that can be identified. Of course, these risks must be balanced against the Federal Reserve's commitment to maintaining a low and stable inflation rate. Indeed, the Fed can help anchor inflation expectations at a low level both through its words and deeds.
Is the Output Gap Smaller than We Think?
It is highly likely that this recession will induce considerable structural change in the economy. Indeed, this development already appears to be in train since many economic resources—labor and capital—that were employed in the automotive, housing and financial industries will need to migrate to industries that offer higher rates of return. One way to gauge the evolving structural change is by viewing the percentage of the labor force that is often characterized as the long-term unemployed (persons unemployed for 27 weeks or longer). As of November 2009, this percentage had risen to 3.8 percent, its highest rate in the post-World War II period.
Those who believe that the Phillips Curve framework can adequately capture the evolution of the inflation outlook over the near term must adequately account for structural changes that might have occurred in the boom and bust in asset prices. In its 2009 Annual Report, the Bank for International Settlements discussed these "bubble-induced distortions" to current estimates of trend output growth and, hence, potential real GDP. Thus, it is conceivable that estimates of potential real GDP at the start of the recession were too large and that the structural adjustments noted above may have subsequently reduced potential real GDP from its artificially high level.
While it is probably unlikely that the fall in actual real GDP during the recession has been matched by the fall in potential real GDP, the size of the output gap might be smaller than conventional wisdom might believe. If so, those who foresee little risk
to the near-term inflation outlook because of a large, persistent output gap may be
too optimistic.
Reinflating Asset Prices
The period following the 2001 recession is an example of how the economy can evolve in ways not readily expected. Recall that during the economic recovery following the recession, job growth remained consistently negative until September 2003—nearly two years after the recession ended. At the same time, the core inflation rate was falling sharply. From December 2001 to December 2003, the year-to-year change in the core CPI fell from about 2.75 percent to about 1 percent. To confront the possibility of "the risk of inflation becoming undesirably low," the FOMC announced at the conclusion of its Aug. 12, 2003, meeting that its low-interest rate policy would be "maintained for a considerable period." In practice, this meant that the FOMC maintained its intended federal funds target rate at 1 percent until the June 30, 2004, meeting.
Although it is often easy to criticize policy after the fact, some economists subsequently concluded that the extended period of low interest rates created a credit boom that started—and prolonged—sharp increases in financial assets and commodity and house prices that put upward pressure on prices paid by consumers and businesses.8 The sharp increase in oil and commodity prices was especially acute. Following increases that averaged about 2.25 percent from 2001 to 2003, the CPI inflation rate averaged 3 percent from 2004 to 2007; the run-up in oil prices to more than $130 per barrel then caused CPI inflation to accelerate sharply, averaging 5 percent over the first three quarters of 2008.
In some respects, the Fed faces a similar problem today: Policy is extraordinarily accommodative (see Figure 1), and the FOMC has said that "economic conditions are likely to warrant exceptionally low levels of the federal funds rate for an extended period." Although low interest rates are a key part of the FOMC's strategy to boost economic growth and cement the health of the economic recovery, there might still be a danger of inflating asset prices by encouraging investors and speculators to shift out of low-yield assets like Treasury securities into higher-yielding assets like commodity contracts or other tangible financial assets.
The Exploding Federal Budget Deficit
From fiscal year 2002 to 2008, the U.S. federal budget deficit averaged about $305 billion per year, or 2.5 percent of GDP. In fiscal year 2009, though, the federal deficit totaled about $1.5 trillion, or roughly 11.25 percent of GDP, according to estimates by the U.S. Congressional Budget Office (CBO). The large increase in the deficit reflected legislative policy actions such as the American Recovery and Reinvestment Act of 2009 (fiscal stimulus) and the Troubled Asset Relief Program (TARP), as well as an increase in mandatory government outlays associated with the deep recession. The CBO projects that the federal budget deficit will total nearly $1.4 trillion in fiscal year 2010 and nearly $925 billion in fiscal year 2011.9
Gauging the deficit's potential effect on inflation depends on how it is financed. To see this, consider the government's budget constraint. In its simplest form, the constraint stipulates that if the deficit is not financed by higher taxes, it must be financed in one of two ways: (i) by issuing debt to the public, which includes foreign holders of U.S. Treasury securities; or (ii) by selling government debt to the central bank, which is the Federal Reserve. The latter, also called monetization of the debt, increases the monetary base (high-powered money) and, thus, the money supply. For example, the Federal Reserve announced March 18, 2009, that it would buy up to $300 billion of Treasury securities (beyond its existing holdings at the time). These purchases, which were designed to "help improve conditions in private credit markets," were not sterilized—that is, they were allowed to increase total bank reserves and, thus, the monetary base.
Many economists appear to be concerned about the inflationary implications of the huge increase in government deficit spending that is unfolding. According to a survey published in the June 2009 Blue Chip Economic Indicators, about 42 percent of forecasters see a relatively high risk that U.S. inflation will rise sharply within the next five years because of the government's and the Fed's response to the financial crisis and recession; another 34 percent see little or no risk; the remainder see only a moderate risk.10
The Fed's Strategy
A key difference between the 2003-04 episode—when the Fed held its federal funds interest rate target at 1 percent from June 2003 to June 2004—and today is that the FOMC has used innovative measures to dramatically expand the size of its balance sheet.11 Because this expansion in the monetary base has the potential to greatly expand the nation's money supply when economic activity rebounds, policymakers are, thus, confronted with the potential problem of designing an effective policy to reduce the size of the Fed's balance sheet to prevent a rapid acceleration in money growth that may destabilize inflation expectations. Improving economic and financial conditions have lessened the use of the Fed's special lending facilities; so, some portion of these excess reserves will naturally contract on their own. Still, this process will not be sufficient to prevent a potentially destabilizing surge in money growth, which means that Fed policymakers will have to adopt other, more aggressive strategies. The officials have discussed several methods of doing this, including paying interest on bank reserves, using conventional open market operations and selling outright some of the securities and other assets held on the Fed's balance sheet.12 Regardless of the method used, an improving economy means that the Fed must be prepared to raise its interest rate target to prevent an unwanted expansion in money growth by the banking sector.
Fed Chairman Ben Bernanke and other senior Fed officials are quite confident that they have the tools and the determination necessary to prevent an unwelcome acceleration in inflation or inflation expectations. Unlike previous episodes, though, the magnitude of the policy responses to the financial crisis and the Great Recession suggests that the FOMC's margin of error seems much smaller than at any time in the Fed's history.
Endnotes
- The National Bureau of Economic Research, which dates business cycle peaks and troughs, usually waits several months after the apparent end of the recession to declare the date of the trough. [back to text]
- In essence, high-powered money (the sum of bank reserves and currency in circulation) is used to create bank loans, which expand the supply of money. [back to text]
- See Gavin for a detailed discussion of changes in the monetary base during this period. [back to text]
- Broadly, M2 is the sum of currency, checkable deposits, savings and small-time deposits, and retail money market funds. For a description and definition of the monetary and financial terms used throughout this article, see http://research.stlouisfed.org/publications/mt/notes.pdf. [back to text]
- See Atkeson and Ohanian. [back to text]
- See Bullard's presentation at http://research.stlouisfed.org/econ/bullard/BullardNABEFinalOct112009.pdf. [back to text]
- See Piger and Rasche. [back to text]
- See Taylor and Frankel. [back to text]
- See Congressional Budget Office. [back to text]
- The Blue Chip Survey asked forecasters to gauge their risk of sharply higher inflation on a scale of one to five, with one being "no risk" and five signaling "great risk." [back to text]
- See United States Financial Data to view updated charts of the asset and liability side of the Fed's balance sheet. These charts can be accessed at http://research.stlouisfed.org/publications/usfd/page7.pdf. [back to text]
- See Bernanke. [back to text]
References
Atkeson, Andrew; and Ohanian, Lee E. "Are Phillips Curves Useful for Forecasting Inflation?" Federal Reserve Bank of Minneapolis Quarterly Review, Winter 2001, Vol. 25, No. 1, pp. 2-11.
Bank for International Settlements. "79th Annual Report: 1 April 2008-31 March 2009." Basel, Switzerland, June 29, 2009.
Bernanke, Ben. "The Federal Reserve's Balance Sheet: An Update." At the Federal Reserve Board's Conference on Key Developments in Monetary Policy, Washington, D.C., Oct. 8, 2009.
Congressional Budget Office. "The Budget and Economic Outlook: An Update." The Congress of the United States, August 2009.
Frankel, Jeffrey. "Comment: Real Rates Key to Commodities Prices," Reuters.com, March 2008. See www.reuters.com/article/reutersComService4/idUSDIS96078820080319?pageNumber=1&virtualBrandChannel=0&sp=true.
Gavin, William T. "More Money: Understanding Recent Changes in the Monetary Base." Federal Reserve Bank of St. Louis Review, March/April 2009, Vol. 91, No. 2, pp. 49-59.
Piger, Jeremy M.; and Rasche, Robert H. "Inflation: Do Expectations Trump the Gap?" International Journal of Central Banking, December 2008, Vol. 5, No. 3, pp. 85-116.
Taylor, John B. "Getting Off Track: How Government Actions and Interventions Caused, Prolonged, and Worsened the Financial Crisis." Stanford, Calif.: Hoover Institution Press, Stanford University, 2009.

Views expressed in Regional Economist are not necessarily those of the St. Louis Fed or Federal Reserve System.
For the latest insights from our economists and other St. Louis Fed experts, visit On the Economy and subscribe.
Email Us