


Big Government: The Comeback Kid?
The 20th century saw a significant increase in the size and scope of government. Important factors behind this increase included two world wars, an economic depression in the 1930s, a significant expansion of the welfare state in the early 1960s and an upsurge in environmental regulation in the 1970s. But with the federal government in a deregulatory mode since the early 1980s and with the end of the Cold War in 1989, growth of government spending and of regulatory intervention was rolled back during the 1990s. This development, combined with stronger-than-expected economic growth, helped to produce relatively large budget surpluses from 1998 to 2001 and even larger projected budget surpluses for future years.
These surpluses gave policy-makers the impetus to boost spending in areas outside defense and entitlement programs. Then, in the aftermath of events of Sept. 11, 2001, spending on defense also jumped. But government is not just spending more, it is also regulating more—partly in response to corporate accounting scandals; partly because of the drubbing in the stock market, which sharply reduced the value of 401(k)s and household wealth; and partly in response to the war on terrorism. Is big government staging a comeback?
Rise of the Welfare State
Before the 20th century, government at all levels (federal, state and local) extracted a relatively small slice of national income, chiefly through taxes on economic activity that affected a small percentage of the population. These included taxes on imported goods (tariffs), excise taxes and property taxes. U.S. fiscal policy began to change during World War I and, especially, the Great Depression, when a significant expansion of the U.S. government occurred. Indeed, the foundation of the modern welfare state was laid during the 1930s, which saw social upheaval caused by financial market calamity and by a significant migration of the population from rural to urban areas.
With the unemployment rate rising to about 25 percent in 1933, and with more than 9,000 bank failures between the stock market crash in October 1929 and March 1933, the public sector began to regulate the private sector as never before. Industries that fell under closer government scrutiny, not surprisingly, included banking and finance. At the same time, individuals, families, retirees and small farmers were provided a measure of income security not seen heretofore. This activism, accordingly, required a considerable amount of resources.
Rise of the Regulatory State
The first permanent regulatory agency to combat these forces was the Interstate Commerce Commission, created in 1887 to foster competition in the railroad industry. Roughly 20 years later, the food and medicine industry began to get closer scrutiny with the Pure Food and Drug Act of 1906 and the Meat Inspection Act of 1907. The Federal Trade Commission was created in 1914. A series of financial calamities and bank runs in the late 19th and early 20th centuries finally induced Congress and President Woodrow Wilson to create the Federal Reserve System in 1913, the same year that the modern personal income tax was permanently instituted.
Some economists and policy-makers came to believe that one additional factor sapping the nation’s growth was the rapidly rising estimate of the cost of complying with new government regulations. According to one study, the cost of regulatory compliance totaled $623 billion in 1979 (1995 dollars), roughly 13 percent of real GDP.1 But those direct costs tell only part of the story: These costs do not account for the output lost by the disincentives that they impose on businesses and consumers.
In response, the pendulum began to swing modestly back toward less government intervention and freer markets in the late 1970s. Sectors that saw active deregulatory efforts included the energy and transportation industries and the financial sector. This trend continued into the 1980s, as estimated real regulatory compliance costs fell about 10 percent, while real GDP rose a little more than 30 percent. By 2001, estimated real compliance costs totaled $854 billion, or a little more than 9 percent of real GDP.2
Trends in Government Taxation
The second way to measure the expanding size of the public sector in the 20th century is by the amount of private-sector resources that are claimed by all levels of government. Figure 1 shows that prior to World War I, federal government receipts as a share of GNP/GDP were steadily declining, from about 3 percent in 1900 to a little more than 1.5 percent by 1916. Over this period, receipts claimed by state and local governments were larger so that total government receipts remained roughly constant at about 7.5 percent of GNP from 1900 to 1913. (Only partial data exists for receipts for state and local governments and, hence, total government receipts, before 1929. Before then, we used Gross National Product.) The surge in federal government receipts associated with financing World War I was brief, as this share subsequently fell back to about 2.5 percent by 1931. Still, total government receipts remained near their post-World War I peak of nearly 13 percent because taxes collected by state and local governments remained high.
Two key developments occurred during the 1930s. First, the size and scope of the federal government began to rise rapidly, which displaced many of the activities that state and local governments were accustomed to providing. Accordingly, federal receipts as a share of GDP jumped roughly three-fold between 1931 and 1940, while the share of state and local receipts fell back to just over 8 percent by 1940. The second key development was the financing of World War II. Although the government largely financed the war through the issuance of debt, federal receipts as a share of GDP nonetheless rose to an all-time high (up to that point) of almost 20 percent by 1943. The rising share of federal receipts displaced state and local governments’ receipts further. By the end of the 20th century, state and local governments’ take of private-sector income was about the same as it was at the beginning of the Great Depression, but rising federal receipts caused total government receipts to reach an all-time high in 2000.
The direct manifestation of government taxation is government spending. As seen in Figure 2, government spending at all levels trended steadily higher, reaching a little more than 32 percent of GDP by 1992. A goodly part of this increase was at the state and local level, as expenditures on Medicaid and education began to rise sharply. Since then, government expenditures have drifted lower, paced by reductions at the federal level.
Bigger and More Activist?
The shift from deficits to surpluses arose for many reasons, but three stand out. First, with the end of the Cold War, government expenditures on defense were trimmed sharply. Second, the Budget Enforcement Act of 1990 restricted spending by instituting—among other budgetary rules—caps on discretionary spending and pay-as-you-go budget rules, which required that changes in mandatory spending or revenues be budget-neutral.4 These two developments helped to slow the growth of total government expenditures appreciably. Finally, on the revenue side, the combination of above-trend economic growth beginning in 1997 and an exuberant stock market led to sharply higher government receipts. By 2000, total government receipts as a share of GDP measured 30.5 percent, an all-time high. (See Figure 1.)
The pendulum has now swung modestly in the opposite direction. In its August 2002 report, the CBO projected a cumulative budget surplus of just over $1 trillion for fiscal years 2003-12, about $1.4 trillion less than the March 2002 projection and several trillion less than the May 2001 projection.5 The change in the budget outlook suggests that the three positive budgetary developments mentioned earlier were temporary aberrations.6 If so, the debate over when, or whether, the federal government will ever post another unified budget surplus may be moot. That is, there is significant probability that the size and scope of the federal government are poised to expand.
Post-Sept. 11 Fiscal Policy
Gauging the future size of government is difficult during a period when the government is actively trying to jump-start the economy. In particular, the levers of both monetary and fiscal policy were engaged quite strongly during the 2001 recession—both before and after Sept. 11. Moreover, because the recovery was not proceeding at the vigorous pace that typically occurs following a recession, policy-makers undertook additional stimulative monetary and fiscal actions in 2002. But with the myriad of new challenges faced by public policy-makers and private businesses in the post-Sept. 11 environment, there is concern that the period of minimalist government and of freer markets that has prevailed over the past 20 years or so may be ending. This view is by no means universal, though. According to a recent survey of business economists conducted by the National Association for Business Economics, roughly three out of four disagreed with the assertion that the United States had “entered an activist policy regime."7
If, however, we have entered a more activist policy regime, there is some evidence that the public is more amenable to such a development than in years past. According to a recent Gallup Poll, the public’s confidence in the executive and legislative branches of government has been on the upswing over the past five years and, in the case of the executive branch, rivals the confidence levels seen in 1972 (pre-Watergate).8 In this regard, probably the single-most important event that has galvanized the public’s confidence in government was the public policy response to the Sept. 11 terrorist attacks.
According to the Office of Management and Budget (OMB), the federal government has implemented 41 “significant” federal regulations in the six months following the Sept. 11 attacks.9 These included rules pertaining to domestic security, immigration control, airline safety, financial disclosures and economic assistance to businesses harmed by the direct effects of the attacks.
In light of the government’s response to Sept. 11, the public might also be more inclined to look for activist policy actions in other areas. Financial and corporate accounting scandals over the past year, and the stock market meltdown, put emphasis on renewed regulation in private pensions and corporate governance. In response, Congress passed and President Bush signed the Sarbanes-Oxley Act, which may be the most encompassing overhaul of federal securities regulation since the SEC Act of 1934. Among other things, the Sarbanes-Oxley Act establishes a Public Company Accounting Oversight Board and a new set of mandates for CEOs and CFOs that potentially exposes them to increased liability for corporate financial misconduct.10
But even before Sept. 11, 2001, federal regulatory spending was on the upswing. According to a recent study, real federal spending on regulatory activity posted average annual increases of about 2 percent per year during the 1980s and the first half of the 1990s and then a bit less than 4 percent per year from 1995 to 2000. Then, real federal regulatory expenditures jumped 8 percent in 2001; they are estimated to have surged 14.5 percent in 2002.11 Although they are only over two years, these increases rival the roughly 9 percent rates of growth seen during the 1960s and 1970s.
Increased spending on new regulations is one reason why government outlays are on the rise. Another reason is that policy-makers viewed the large budget surpluses that were being projected in 2001 as an opportunity to ramp up the path of federal spending. This can be seen in Table 1, which depicts, as a percent of nominal GDP, projected cumulative total federal outlays, discretionary and mandatory outlays, net interest payments and the unified budget deficit for fiscal years 2003 to 2009. For example, in 1999, CBO projected that cumulative—that is, the sum for each of the years—federal government outlays for the years 2003 through 2009 would average 17.7 percent of GDP. At the same time, projected revenues were expected to average 20.2 percent of GDP from 2003-09. The projected path of revenues and outlays was thus expected to produce a surplus that averaged 2.5 percent of GDP. By the time the CBO’s 2001 report was published, the agency was projecting that this average surplus (for years 2003-09) would increase to about 3.8 percent of GDP.
But as the latest projections (August 2002) show, the CBO now estimates that the federal government will spend an amount over the 2003-09 period totaling almost 19 percent. All of this upsurge in future spending is with discretionary spending, such as defense, the 2002 Farm Security and Rural Investment Act (Farm Bill) and net interest. But yet another reason why spending is on the upswing is the war on terrorism, something policy-makers and CBO forecasters could not have predicted in 1999
or 2001.
Although the CBO tends to use conservative economic assumptions when making its projections, the inability of forecasters to predict unforeseen events is one reason why this assessment might be understated. This helps to explain, as Kliesen and Thornton (2001) showed, why errors in projecting federal government outlays five years into the future averaged roughly 2.25 percent of GDP from 1976 to 1999. But there are other reasons why the August 2002 projections for outlays for 2003-09 are probably understated. First, the CBO is required to assume a permanent renewal of the Budget Enforcement Act of 1990, which has helped to restrain expenditures. Second, the Balanced Budget and Emergency Deficit Control Act of 1985 requires the CBO to project annual increases in discretionary spending at the rate of inflation, roughly 3 percent per year from 2003 to 2012. But if discretionary spending grew at an average annual rate of 8.5 percent, which was the actual rate of growth from 1998 through 2002, then cumulative total outlays (discretionary spending plus net interest) from 2003 to 2009 would be nearly $1.3 trillion higher, or about 1.5 percent of GDP.
Finally, the CBO’s projections do not incorporate commitments that the federal government seems poised to make. These include outlays for future war-like hostilities (and subsequent rebuilding efforts), the homeland security legislation (passed in November 2002) and a Medicare prescription drug program, which CBO estimates would add another $341 billion in outlays over the 2003-12 projection period. The latter is potentially very important since the retirement of the baby boom generation, by itself, will exert a huge drag on the resources of future workers (i.e., higher future taxes and government spending). Hence, we should not be so sanguine that, as projected, federal legislators will be slowing the growth of government discretionary spending after 2003.
A Cautionary Note
Entering the 21st century, the U.S. economy is the strongest in the world, with fairly strong productivity growth and very low and stable inflation. Despite one of the mildest recessions on record, monetary and fiscal policy has been extremely expansionary over the past year. Few economists expect Federal Reserve policy-makers to allow inflation to become the problem that it was in the 1970s. On the fiscal side, however, the upswing in government spending, buttressed by a more activist regulatory policy, suggests public policy-makers want to rely less on market forces. If so, policy-makers should be wary about repeating past mistakes.
Government Receipts as a Share of GNP/GDP
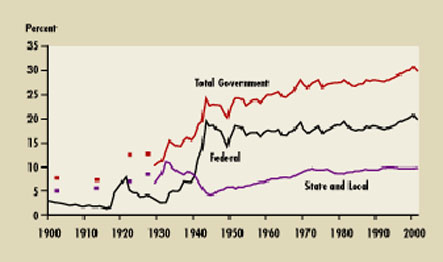
NOTE: Prior to 1929, series represented as shares of GNP. Receipts for state and local governments are incomplete between 1900 and 1929.
SOURCE: U.S. Department of Commerce, Bureau of Economic Analysis. Data prior to 1929 are from the U.S. Department of the Census (1975).
Government Expenditures as a Share of GDP
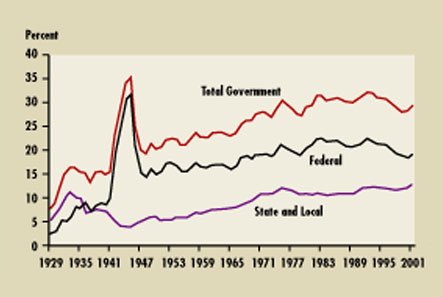
SOURCE: U.S. Department of Commerce, Bureau of Economic Analysis. Data prior to 1929 are from the U.S. Department of the Census (1975).
Changes in Budget Projections
SOURCE: Congressional Budget Office (various years).
Each column shows the baseline projection made by the Congressional Budget Office in that year for the period 2003-09. The numbers in each column represent that category as a percent of nominal GDP.
Endnotes
- The National Bureau of Economic Research, which is the official arbiter of business cycle dates, has not yet announced the end date of the recession that began in March 2001. The graph assumes that this recession ended in December 2001. [back to text]
- Measured in 2000 dollars. See Crews (2002). [back to text]
- See Kliesen and Thornton (2001). [back to text]
- See Crippen (2001). [back to text]
- The CBO’s projections place the cause of the decline in the surplus roughly equally split between falling revenue and rising expenditures. See Congressional Budget Office (2002). [back to text]
- The CBO could not have foreseen the events of Sept. 11, the subsequent war on terrorism, the 2001 recession and the plunge in equity values. [back to text]
- See NABE (2002). [back to text]
- http://www.gallup.com/poll/releases/pr020902. [back to text]
- See Executive Office of the President (2002). [back to text]
- See Blumenstein, Clowes, Holt Frankle and Stanton (2002). [back to text]
- See Dudley and Warren (2002). [back to text]
References
Blumenstein, Paul; Clowes, J. Howard; Holt Frankle, Diane; and Stanton, Scott. "President Signs Sarbanes-Oxley Act of 2002," GrayCary law firm. http://www.gcwf.com/articles/interest/ interest_55.html
Congressional Budget Office. “The Budget and Economic Outlook: An Update.” Report to the Senate and House Committees on the Budget. Washington, D.C., August 2002.
Crews, Clyde Wayne, Jr. “Ten Thousand Commandments: An Annual Snapshot of the Federal Regulatory State,” Cato Institute. Washington, D.C., 2002.
Crippen, Dan L. “Extending the Budget Enforcement Act.” Statement before the Committee on the Budget, U.S. House of Representatives, June 27, 2001.
Dudley, Susan and Warren, Melinda. “Regulatory Response: An Analysis of the Shifting Priorities of the U.S. Budget for Fiscal Years 2002 and 2003,” 2002-2003 Annual Report, Regulatory Budget Report No. 24, June 2002. Weidenbaum Center on the Economy, Government, and Public Policy at Washington University in St. Louis; and the Mercatus Center at George Mason University in Arlington, Va.
Executive Office of the President. “Draft Report to Congress on the Costs and Benefits of Federal Regulations,” Office of Management and Budget, March 28, 2002. http://www.whitehouse.gov/omb/inforeg/cbreport.pdf.
Hopkins, Thomas D. “Regulatory Costs in Profile,” Center for the Study of American Business at Washington University in St. Louis, Policy Study No. 132, August 1996.
Kliesen, Kevin L. and Thornton, Daniel L. “The Expected Federal Budget Surplus: How Much Confidence Should the Public and Policymakers Place in the Projections?” Federal Reserve Bank of St. Louis Review, March/April 2001, Vol. 83, No. 2, pp. 11-24.
National Association for Business Economics News, NABE Panel Gives Monetary Policy Rave Reviews But Fiscal Policy Mixed; Double-Dip Recession Unlikely. March/April 2002. No. 150, p. 8.

Views expressed in Regional Economist are not necessarily those of the St. Louis Fed or Federal Reserve System.
For the latest insights from our economists and other St. Louis Fed experts, visit On the Economy and subscribe.
Email Us