


The Crisis That Wasn't: Asia and the Eighth District
In 1998, U.S. real merchandise exports to East Asia fell by 12 percent as the Asian economic and financial crisis reduced demand throughout the region for goods produced in the United States.1 Many forecasters predicted that the fallout from the Asian crisis would severely reduce U.S. growth. Despite the decline in these exports, however, the U.S. economy continued to expand, as domestic demand remained strong. Did the Eighth District mimic the U.S. experience?
Asia Major or Minor?
The markets of East Asia are, on average, less important to Eighth District exporters than they are to exporters in the United States, overall. As shown in the top panel of the accompanying figure, in 1997, the District sent 19 percent of its manufacturing exports to East Asia, which is less than the 27 percent average for the United States. This difference is not surprising because western states tend to have stronger trade links with Asia than do other states. Arkansas was the only District state whose manufacturers sent a higher share of their exports to East Asia than the national average.
Asian Crisis Reduces Eighth District Exports
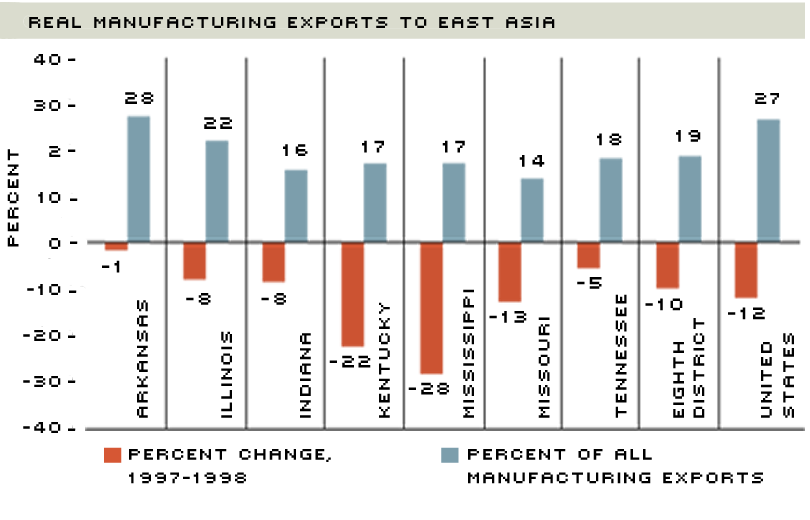
Not only are East Asian markets less important for Eighth District exporters in other parts of the United States, but the District's exports to the region also fell by less than the national average. Nevertheless, some states—like Kentucky and Mississippi—experienced sharp declines in exports to the region during 1998.
SOURCES: U.S. Department of Commerce, Bureau of the Census; Department of Labor, Bureau of Labor Statistics
Within East Asia, some markets are more important to District states than others. Japan is the most important export destination in East Asia for each state in the District, with 35 percent of the District's manufacturing exports shipped to Japan in 1997. Over half of Kentucky's manufacturing exports headed for East Asia went to Japan. All other District states sent at least 29 percent of their exports to Japan.
Korea and Hong Kong are the next most important export destinations, accounting for 14 and 13 percent of the District's exports to Asia, respectively. Missouri sent the largest share of its exports to Korea—16 percent in 1997—while Arkansas sent the lowest share to Korea—10 percent. In contrast, Arkansas sent 30 percent of its manufacturing exports to Hong Kong—the highest of any District state—while Missouri sent only 6 percent—the lowest of any District state. The remaining seven countries represent much smaller export markets for the District states. Only Mississippi sent more than 10 percent of its East Asian manufacturing exports to any of these countries. China was Mississippi's second most important market, receiving 15 percent of the state's manufacturing exports to the region in 1997.
District exports to East Asia are highly concentrated in a few product categories. Two-thirds of Eighth District manufacturing exports to the region fall into one of three categories: machinery (both electrical and nonelectrical), chemicals and transportation equipment. Arkansas is the only District state whose major export product to East Asia does not fall into one of these categories; 43 percent of its manufacturing exports to the region consisted of food products, such as chicken. This was well above the District average of 8 percent.
Falling Exports
In the wake of the East Asian crisis, Eighth District manufacturing exports to the region fell by 10 percent between 1997 and 1998, slightly lower than the 12 percent drop for the United States overall. Although exports from all District states decreased, there was much variation across states, as shown in the bottom panel of the figure. Arkansas' manufacturing exports to East Asia fell by only 0.7 percent—the smallest decrease among District states—while Mississippi's exports fell by 28 percent—the largest District decrease.
The importance of the preceding declines in exports on a state's manufacturing output depends on the importance of the East Asian markets to manufacturing output. In 1997, 2 percent of the District's manufacturing shipments went to East Asia, which was well below the 4.2 percent U.S. figure. Moreover, no District state ranked above the national average. The leading District state, Illinois, sent 3.3 percent of its manufacturing shipments to East Asia. The shares of the remaining District states were: 1.8 percent for Tennessee, 1.5 percent each for Indiana and Kentucky, 1.4 percent for Arkansas, and 0.9 percent each for Mississippi and Missouri. These low shares indicate that the direct effect of the East Asian crisis on District manufacturing was relatively minor.
Eighth District Effect
The change in manufacturing exports, along with the share of these exports in manufacturing shipments, suggests that the trade shock reduced the District growth rate of manufacturing output by 0.19 percentage points.2 In contrast, the trade shock lowered U.S. output growth by 0.50 percentage points. Generally speaking, then, District states suffered only minor reductions in their manufacturing output growth rates. Given the small drop in its exports, it's not surprising that Arkansas was the least affected, with an estimated 0.01 percentage point decline in its manufacturing sector's growth rate. Kentucky was the most adversely affected. Its decline in East Asian exports lowered the manufacturing growth rate by 0.33 percentage points. Although Illinois' exports fell by far less than Mississippi's, the growth rate of manufacturing output in these two states fell by the same amount, 0.26 percentage points. This is because Illinois manufacturers are much more dependent on East Asian markets.
Based on these numbers, it appears that the Asian crisis had a negative effect on District manufacturing output growth. These results do not, however, imply that District manufacturing output fell in 1998. The negative export effect on growth from the Asian crisis may have been offset by strong domestic demand or other countervailing factors. Although 1998 state level manufacturing output data are not yet available to confirm this suspicion, manufacturing employment growth may provide some insight into the overall effect on output.
Eighth District manufacturing employment rose by 0.55 percent in 1998—an increase of 18,700 jobs. This change mirrors the national economy, which showed an increase of 0.52 percent. Given the continued rapid increases in U.S. manufacturing productivity during 1998, the uptick in District manufacturing employment undoubtedly indicates an upturn in District manufacturing output. Despite the negative effect the trade shock has had on the manufacturing sector, Tennessee was the only District state in which manufacturing employment fell in 1998. Manufacturing jobs there declined by 0.56 percent. Moreover, among District states with increases in manufacturing employment, Arkansas—whose manufacturing sector took the smallest hit from the Asian crisis—had the smallest gain in manufacturing jobs, at 0.44 percent. Meanwhile, Mississippi, which was one of the hardest hit states, enjoyed one of the largest increases in manufacturing jobs—1.1 percent.
Crisis—What Crisis?
Why didn't the Asian crisis have a noticeable effect on manufacturing employment in the Eighth District? The simple answer is that, as in the United States as a whole, domestic demand offset the drop in exports. Many of the goods that were not bought by Asian consumers were bought by U.S. consumers and firms. But what caused the increased demand by U.S. consumers? Ironically, the Asian crisis itself may have played a role since it set in motion numerous economic changes that affected not only international trade flows, but also commodity prices and interest rates. A reduction in demand for commodities by the East Asian countries helped to lower prices for these products on world markets. The price of crude oil, for example, fell by 34 percent in 1998. The resulting savings in energy expenditures enabled consumers to spend more on other goods. In addition, the Asian crisis led investors worldwide to seek safe assets, such as U.S. Treasury securities. This resulted in reductions in interest rates on these securities, as well as on a range of consumer debt instruments. Lower interest rates then stimulated spending on goods, such as automobiles. These indirect effects of the Asian crisis likely had a greater influence on the Eighth District economy than did the direct trade effect. As a result, Eighth District manufacturers were relatively unaffected because demand by U.S. consumers replaced demand by Asian consumers. So, for Eighth District manufacturers at least, the Asian crisis appears to have been the crisis that wasn't.
Endnotes
- In this article, East Asia refers to: China, Hong Kong, Indonesia, Japan, Korea, Malaysia, Philippines, Singapore, Taiwan and Thailand. An overview of the Asian crisis appears in Neely (1999). [back to text]
- For an analysis of all 50 states, see Coughlin and Pollard (2000). [back to text]
References
Coughlin, Cletus C., and Patricia S. Pollard. "State Exports and the Asian Crisis," Federal Reserve Bank of St. Louis Review (January/February 2000), pp. 3-13.
Neely, Michelle C. "Paper Tigers? How the Asian Economies Lost Their Bite," The Regional Economist (January 1999), pp. 4-9.

Views expressed in Regional Economist are not necessarily those of the St. Louis Fed or Federal Reserve System.
For the latest insights from our economists and other St. Louis Fed experts, visit On the Economy and subscribe.
Email Us