


Price Stability And The Rising Tide: How Low Inflation Lifts All Ships
The strong economic performance that the United States has logged over the last eight years has generated much good news. Consider the highlights: Since the beginning of 1992, quarterly real gross domestic product (GDP) growth has averaged 3.7 percent at an annualized rate, compared with an average of only 2.6 percent over the prior 20 years; the unemployment rate has fallen to its lowest level in almost 30 years; and employment has grown steadily, so that there are now over 16 million more people employed. This performance was achieved during a period in which inflation was at or below 3 percent.
Low and stable inflation—price stability, for short—has been a necessary ingredient in the current expansion. When prices are unstable, businesses and households face more uncertainty about the future, making it more difficult for them to plan efficiently. When people plan inefficiently, unavoidable mistakes are more common, which leads to greater variability in growth and employment. If inflation hadn't been kept in check over the last decade, slower growth, and possibly a recession, would have almost certainly followed soon after.
Although few would question the Federal Reserve's recent success in maintaining price stability, many are worried that gains from the resulting expansion have not been distributed broadly, and that significant segments of society are being left behind. High on the list of concerns are increases in wage equality and stagnant or falling wages for low-income groups.
The balance of the evidence, though, shows that there is less to be worried about—much less—than some believe, and that there have been strong employment and income gains for most broad categories of the population. In fact, some groups that began the period in the worst economic shape—including teen-agers and those with the lowest education and income levels—have enjoyed substantial gains. Sustained prosperity made possible by price stability has brought greater opportunities for all groups and, in the process, has transformed labor markets. Perhaps the most remarkable change has been the increased employment opportunities for blacks and women. The shares of these groups that are employed are higher than they have been for many years.
The effects of continued price stability and growth on labor markets are best illustrated by a dissection of some of the aggregate employment numbers. Doing so presents a picture of an economic expansion that, in terms of falling unemployment, greater employment opportunities, and rising incomes, has been beneficial for a broad cross section of the population.
Unemployment Falling Down
Because it is the most widely used indicator of labor market performance, any analysis of the current expansion begins with the unemployment rate. Since peaking at 7.8 percent in June 1992, the unemployment rate has fallen steadily, reaching 4.3 percent in December 1998, where it has hovered ever since. When these unemployment numbers are broken down, it becomes apparent that the expansion has been particularly beneficial for groups that began the period in the relatively worst situations—specifically, blacks, teen-agers and the less-educated.
Figure 1
The Rising Tide Lowers Unemployment
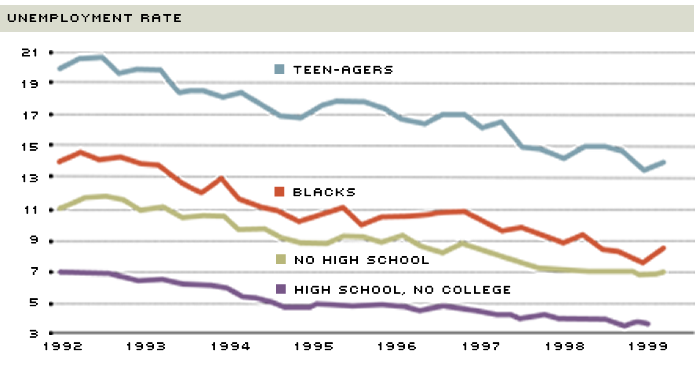
Since 1992, unemployment rates have fallen steadily for teen-agers, blacks and those with less than a college education. In fact, the unemployment rate for blacks is lower than at any time since 1972, and the rate for teen-agers is at a 30-year low.
SOURCE: Bureau of Labor Statistics
In 1992, the unemployment rate for blacks averaged 14.2 percent. That rate fell to 8.3 percent by the third quarter of 1999, and it appears that the average rate for 1999 will be even lower than for the previous year, which was lower than at any time since 1972. Continued economic growth has narrowed the unemployment gap between whites and blacks. From the first quarter of 1998 to the third quarter of 1999, the black unemployment rate has fallen considerably, from 9.3 percent to 8.3 percent. Over the same period, the unemployment rate for whites has fallen less, from 4.0 percent to 3.7 percent. Although these data show that there has been a good deal of progress in reducing the unemployment gap between whites and blacks, they also show that the gap is still large. There is certainly good reason to believe, though, that ongoing economic growth will narrow the gap even further.
The expansion has also meant good news for young people. The teen-age unemployment rate, which in 1992 averaged 20.1 percent, has fallen steadily, to 13.7 percent for the third quarter of 1999—a 30-year low. Even during the strong growth of the 1980s, teen-age unemployment never dropped below 15 percent—a level that this expansion achieved nearly two years ago. Black and white teen-age unemployment are both at their lowest levels in 30 years, although the white teen-age unemploymet picture is still much better.
Well-educated workers continue to be highly valued by employers. Nevertheless, the less-educated have clearly benefited from the economic growth of the 1990s. In the third quarter of 1999, the unemployment rate for those older than 25 who did not have a high school diploma was 6.9 percent, having fallen from a high of 12.2 percent in mid-1992. For those with a high school diploma who never went to college, unemployment was at 3.6 percent, having fallen from 7.3 percent in mid-1992.
It appears, then, that despite the concern that an increasingly high-tech economy will leave the less-educated behind, there has been room in the U.S. economy for the relatively unskilled. What has happened, as anyone can confirm by talking to employers, is that the shortage of well-qualified workers has led firm after firm to hire less-educated workers, and those with poor employment histories, and train them. On-the-job training has assumed increasing importance in the United States, and the results are gratifying. Firms find that not everyone hired works out, but a significant proportion do. The end result is that not only is the U.S. economy generating employment for many left behind in earlier years, but these workers are also developing new skills that will undoubtedly yield opportunities for them in the future.
A Changing Face
Although unemployment rates are useful indicators of labor market performance, they tell only part of the story. During any period in which employment opportunities are expanding, two things happen: First, more people become employed; and, second, more people who had been choosing to stay out of the labor force decide to enter it. Although both of these effects are important, newspaper reporters and TV newscasters tend to look only at the first, and to ignore the second. This incomplete view of the current expansion misses some very dramatic changes that have been transforming the labor market—perhaps permanently—as relatively larger proportions of certain groups have been drawn into it.
One way to get an idea of how the labor market has been transformed by the current expansion is to look at the ratio of employment to population for various demographic groups. As shown in figure 2, employment-to-population ratios highlight one of the great successes of the recent expansion—rising percentages of women and blacks who are employed. Between February 1992 and November 1999, the share of adult white women who were employed rose by 3 percentage points; the share of adult black men rose by 3.8 percentage points; and the share of adult black women rose by 8.8 percentage points. Comparing these numbers for black men and women with those for the 20 previous years reveals the depth of these changes. Between 1972 and 1992, the share of black men employed actually fell by 8.7 percentage points, and the share of black women grew by 7.1 percentage points.
The Changing Face of the Labor Market
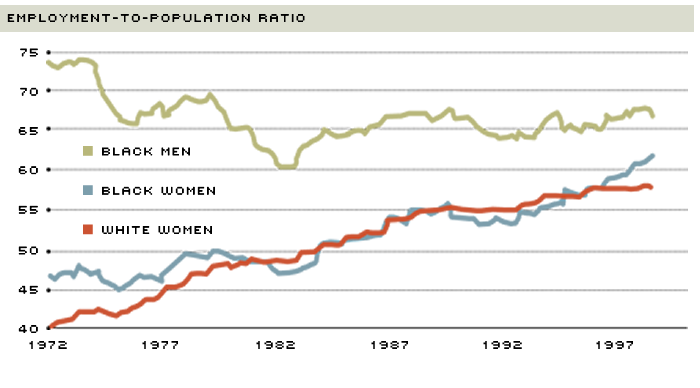
Since 1992, larger shares of women and black men have become employed. Historically high proportions of the female population were employed in 1999, and black men have been regaining some of the ground lost between 1972 and 1991.
SOURCE: Bureau of Labor Statistics
One of the reasons that blacks have been making such steady gains in the 1990s compared with the previous two decades is that the economy has experienced steady growth. Over the last eight years, the economy has not experienced the downturns that, in the past, have hindered or reversed gains made during upturns. Consequently, the face of the working population has changed dramatically, as women and blacks make up larger shares of employment than at any time since the end of World War II. The longer the current expansion is sustained, the more likely it is that these gains will continue and become permanent, as women and blacks become entrenched in the work force.
Fewer Poor People, More Rich People
While the evidence indicates that employment opportunities have improved for broad classes of people, it says little about their overall economic well-being. There are various ways of measuring well-being—the most common being per capita income or earnings. Based on these broad income measures, the average person has been doing better since 1992. According to the Bureau of Economic Analysis, between the third quarters of 1992 and 1999, per capita real disposable personal income rose by 15 percent.
Despite this evidence, various studies, news articles and pundits have claimed that the expansion has left behind the poorest. The argument is usually based on data showing that the average real wage has not increased very much, or that the average real wage of the poorest wage earners is not much higher—or is even lower—than before the expansion began.
Because of the inclusion into the labor force of many who were previously excluded, it is important to be wary, however, of any claims based on average wages. The wages of these newly employed persons, who tend to have less-than-average work experience and skill levels, are generally lower than for those who are already employed. As these low-wage workers are added to the ranks of the employed, the average wage for all workers can go unchanged, even if the wages of those already employed rose.
To see how this process works, consider a scenario in which there are only two groups of workers—long-term workers and newly employed workers. As in the actual economy, the newly employed workers are unskilled relative to the long-term workers; they also join the ranks of employed persons at low wages. The change in the average wage of all workers from one year to the next reflects two forces: the increase in long-term workers' wages, and the addition of newly employed workers with their lower-than-average wages.
In this scenario, suppose that there were 10 long-term workers last year, each of whom earned $20 an hour. In the new year, each of these workers received a 10 percent pay increase—to $22 per hour—and two new workers were hired at $10 an hour. The average wage for the 12 workers is, therefore, $20 an hour—10 workers at $22 each ($220), plus two workers at $10 each ($20), equals $240, for an average wage of $20.
In this illustration, there has been no change at all in the average wage, despite the fact that 10 of the workers enjoyed wage increases of 10 percent, and two workers went from being unemployed to jobs that pay $10 an hour. This illustration helps explain why most workers feel, and in fact are, better off, even though the average wage may be growing slowly. Those who continue to be employed are receiving wage increases, and the newly employed are finding jobs that bring more income and, presumably, greater personal satisfaction than before.
To measure how the economic well-being of low-wage earners has changed, it is necessary to look at the entire population. One relatively straightforward approach, illustrated by figure 3, is to look at recent Census Bureau data on the percentages of households in three constant-dollar income classes—Low, Middle and High—for 1992 and 1998. Those in the Low group have incomes below $25,000, those in the Middle group have incomes between $25,000 and $50,000, and those in the High group have incomes above $50,000. In 1992, 36 percent of households were in the Low group, but by 1998, only 32 percent were. Further, over the same period, the share of households in the Middle group fell from 31 percent to 29 percent. This means that the only income group that has grown during the current expansion has been the High group, which increased from 34 percent to 39 percent of all households. This mobility likely continued into 1999, pushing even larger shares of the population into the higher income groups. Although these numbers are by no means definitive, they do illustrate the positive effect that the current expansion has had on the economic well-being of all income groups.
The Rich Get Richer ... Along With the Rest of Us
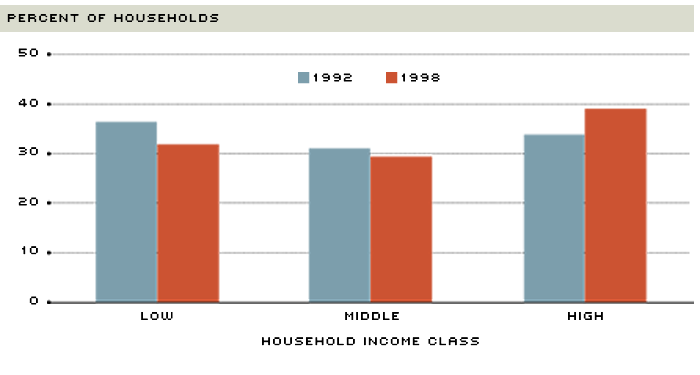
Between 1992 and 1998, the percent of households in the low (less than $25,000) and middle ($25,000 to $50,000) income groups fell. At the same time, the percent of households in the high ($50,000 and above) income group rose.
SOURCE: Bureau of the Census
Price Stability Has Been Good for Everyone
The strength and endurance of the current economic expansion in the United States is largely due to the Federal Reserve's success in maintaining price stability. As a result of the expansion, many groups of people who were marginalized or excluded from employment have been drawn into it: The unemployment rates for blacks, teen-agers and the less-educated have fallen steadily; more and more women and blacks have been drawn into the work force; and large numbers of households have been earning more. In short, price stability has been good for everyone.
Endnotes
- Growth data are from the Bureau of Economic Analysis. Employment and unemployment data are from the Bureau of Labor Statistics Household Survey. [back to text]
- Due to rounding errors, the shares for 1992 add up to 101 percent. [back to text]
Views expressed in Regional Economist are not necessarily those of the St. Louis Fed or Federal Reserve System.
For the latest insights from our economists and other St. Louis Fed experts, visit On the Economy and subscribe.
Email Us