


What's Up Down on the Farm?
Nineteen ninety-six was a pretty good year for farmers in the Eighth Federal Reserve District. Above-average prices and higher-than-normal crop yields in the past year are expected to produce a substantial rebound in aggregate farm income. These increases also bode well for rural businesses—like automobile and farm machinery dealers—which expect farmers to spend a good part of their increased fortunes on Main Street.
1996 Farm Income: Lots of "Spendin' Cabbage"
The most commonly cited measure of farm income is the United States Department of Agriculture's (USDA) net farm income series. Net farm income (NFI) is the sum of crop and livestock receipts, government farm program payments, noncash income (such as the value of food grown on the farm for home consumption) and other miscellaneous farm-related income, less production expenses (including labor and property taxes), a capital consumption allowance (depreciation) and taxes and interest on real estate. Net farm income also includes the value of the change in farm inventories, which is the difference between the value of farm inventories at the beginning and end of the year. By this measure, the USDA projects real farm income to be $46.2 billion in 1996, more than 43 percent above that registered in 1995, and more than 8 percent above its 1990-95 average.1
The USDA expects most of the rise in real 1996 NFI to come from a $6.3 billion increase in the value of farm inventories and a $6.0 billion increase in crop receipts. A further boost to farm income is expected from the sales of livestock and related products, which are predicted to increase $3.4 billion in 1996. Overall, this jump in farm incomes reflects the effects of both higher prices and increased production. On the price side, through the first three quarters of 1996, the USDA's index of aggregate crop prices was at its highest level since the series began in 1975. Similarly, the index of livestock prices in the third quarter of 1996 was at its highest in six years. On the output side, total meat production through the first 10 months of 1996 was up a little more than 2.5 percent from the same period in 1995, while the fall harvest was generally bountiful, produced bin-busting crops.
Although corresponding state level data will not be available until late 1997 at the earliest, unless a state suffers from an unusual weather-related development, national trends in farm income typically hold at the state level as well.
District Farmers Cash In
In the upper reaches of the Eighth Federal Reserve District, corn and soybeans reign as the dominant crops, while in the southern parts, cotton and rice are king.2 The District is also home to a significant portion of the nation's production of broilers (in Arkansas) and catfish (in Mississippi). To understand why crop receipts and the value of farm inventories contributed so heavily to the rise of real NFI in 1996, it's helpful to look at how the corn, cotton, rice and soybean harvests fared in the District and the United States last year. As the accompanying figure indicates,with the exception of rice, production of the four crops in the seven District states in 1996 surpassed that in 1995. In the case of corn and soybeans, substantially more output was produced last year, while in the case of cotton, only a modest increase in production was seen.3
Eighth District 1996 Crop Production
As a Percent of 1995 Production
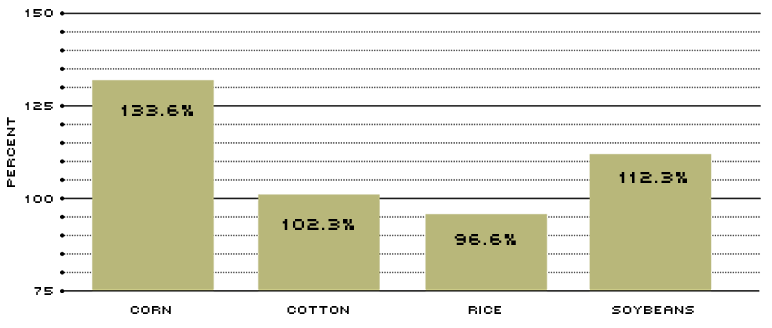
SOURCE: U.S. Department of Agriculture
Corn
As the figure shows, corn production in the District last year was a little more than a third larger than the crop harvested in 1995. The two largest corn-producing states—Illinois and Indiana—saw increases of 31 and 13 percent, respectively, while Missouri's production more than doubled, and Arkansas' harvest nearly doubled. The uptick in production occurred because harvested acreage increased in all seven states and—except for Arkansas and Tennessee—yields were also higher in 1996 than in 1995.
At 9.3 billion bushels, the national 1996 corn crop was the third largest on record. This surpassed the 1995 crop by more than 25 percent, but fell about 8 percent short of the 1994 record. Normally, a surge in production of this magnitude would push corn prices down significantly. However, because the supply of U.S. corn ended the 1995/96 marketing year at its lowest level in more than two decades, the increased production is expected to keep 1996/97 ending stocks (inventories) about 23 percent below their 1990-95 average. As a result, the average price of corn for the 1996/97 marketing year is expected to be about $2.70 a bushel, which is much higher than the $2.30 average that prevailed from 1990 to 1995, but still well below the $3.24 average for 1995/96.
Cotton
Four states in the Eighth District—Arkansas, Mississippi, Missouri and Tennessee—accounted for one quarter of the U.S. cotton crop last year, which, at an estimated 18.6 million bales, was the third largest on record. Despite the fact that nearly 11 percent fewer acres were harvested in Arkansas last year and 27.5 percent fewer were harvested in Mississippi, the four-state production total was still 2.3 percent larger than in 1995. A large jump in cotton yields is credited for the increase, with the average four-state yield more than 25 percent above the 1995 average. In fact, the 1996 U.S. cotton crop was the fourth highest yielding on record. Strong domestic demand by textile producers is expected to keep cotton prices in the 1996/97 marketing year about 7.5 cents a pound higher than the 64.5-cent average from 1990-96.
Rice
U.S. rice production is heavily influenced by Arkansas, which regularly ranks as the nation's largest producer, and, to a lesser extent, Mississippi. Combined, the states account for almost half of U.S. production; adding in Missouri's crop pushes the District share to 52.5 percent. Last year's production in the Eighth District was down 3.4 percent from 1995. Accordingly, the U.S. rice crop increased just 0.1 percent from 1995.
Although Arkansas farmers harvested 7.5 percent fewer acres, their rice crop last year was up 0.2 percent from 1995, as yields surpassed the all-time record set in 1994. In Mississippi, the number of harvested acres dropped by almost a quarter, and, although yields rose by more than 9 percent, total production fell by slightly more than 17 percent. Missouri's rice crop dropped by a little more than 11.5 percent, with both yields and harvested acres below those seen in 1995. The drop in District rice production stemmed from fewer acres being planted in the spring, as many farmers—particularly in Mississippi—planted corn instead to take advantage of the high prices that prevailed at the time.
With 1996 U.S. rice production little changed from 1995, and domestic use in the current (1996/97) marketing year expected to be only modestly above the five-year average, ending rice stocks in 1996/97 are projected to fall to a near all-time low of 25.6 million hundredweight.4 As a result, the USDA projects rice prices to average 92.5 cents a pound in the current marketing year, up a little more than a penny a pound from the year before, and the highest average price received by farmers since 1980/81.
Soybeans
The 1996 District soybean crop was a little more than 12 percent larger than the 1995 one. In Illinois and Indiana, the two largest-producing states of the seven, last year's crop was up more than 6 percent. By contrast, in Missouri and Arkansas, the 1996 soybean crop increased by 19 percent and 30.3 percent, respectively. Except for Missouri and Tennessee,1996 harvested acres in the District exceeded those from 1995, while yields were generally little changed from the previous year.
Estimated at 2.4 billion bushels, the 1996 U.S. soybean crop was the second largest on record, surpassed only by the 2.5-billion bushel 1994 crop. Nevertheless, in the current marketing year ending stocks—which fell to a seven-year low in 1995/96—are still expected to end up well below the 1990/95 average. Thus, the USDA projects that soybean prices in 1996/97 will average about $6.50 a bushel, down only modestly from the seven year high posted in the previous year, but still well above the $5.92 average from the 1990-96 period.
Overall, 1996 was a memorable one for Eighth District farmers. With crop inventories generally well below their five-year average, it appears that farm prices will stay at relatively high levels this marketing year. Coupled with the bumper harvests yielded by many crops, real farm incomes in 1996 should greatly exceed those logged during the previous year.
Endnotes
- Forecasts of farm income for 1996 are preliminary estimates only. USDA farm income forecasts are originally expressed in current dollar (nominal) terms. In this article, they have been inflation adjusted using the gross domestic product (GDP) price index. See USDA (1996). [back to text]
- The seven-state area comprises all of Arkansas and parts of Illinois, Indiana, Kentucky, Mississippi, Missouri and Tennessee. See back cover. [back to text]
- Estimates of 1996 production, yields, acres harvested, ending stocks and average prices received by farmers come from the USDA's Crop Production Report and the World Agriculture Supply and Demand Estimates, both of which were released in November of 1996. Analysis of corn, cotton, rice and soybeans typically refers to marketing years rather than calendar years. Marketing years for corn and soybeans begin on Sept.1 and end on Aug. 31 of the subsequent year. The marketing year for cotton and rice runs from Aug.1 to July 31. Forecasted prices for 1996/97 refer to the USDA's midpoint estimate of marketing year average price. [back to text]
- A hundred weight is a unit of measurement for rice consisting of 100 pounds. [back to text]
References
United States Department of Agriculture. Crop Production, National Agricultural Statistics Service, November 12, 1996.
United States Department of Agriculture. World Agriculture Supply and Demand Estimates, World Agricultural Outlook Board, November 12, 1996.

Views expressed in Regional Economist are not necessarily those of the St. Louis Fed or Federal Reserve System.
For the latest insights from our economists and other St. Louis Fed experts, visit On the Economy and subscribe.
Email Us