


The Overlooked 40 Percent: The Rural Eighth District
Over the past few decades, much has been made of the blight and subsequent revitalization of urban America.1 Many cities have witnessed population and job flight to the suburbs. To lure back many of these lost jobs and residents, local, state and federal governments have devised a wide range of incentives, usually involving infrastructure improvements or tax breaks for real estate development or new employment.2 Numerous cities have since rejuvenated their business districts.
At the same time, however, scant attention has been paid to development in rural areas. Historically, farm policy had been thought of as constituting rural policy. But farming has changed over time, becoming much more sophisticated because of dramatic advances in technology.3 In 1960, farm output made up about 4 percent of all U.S. output; today it comprises only a bit more than 1 percent. Yet despite farming's falling share of total output, rural areas have continued to record income and employment growth. Areas that were once thought of as primarily farmland are today much more diverse and, in fact, have been posting some of the nation's strongest income and employment growth over the last 10 to 20 years, even though only 20 percent of the nation's population lives there. Strikingly, though, 40 percent of the Eighth Federal Reserve District's population lives in nonmetropolitan areas, making rural policy and development even more important in this area.4
A Snapshot of District Rural Areas
Eighth District rural areas largely are agricultural. District states are home to almost one-fourth—about half a million—of all farms in the country. Missouri alone contains about 5 percent of the nation's farms. But, because the farms in our District are generally about half the size of those in other parts of the country, they constitute only a little more than one-eighth of the nation's farm acreage—about the same as in Texas. District farm output contributes just 2 percent to the region's total output, making it slightly more important here than it is in the rest of the nation.
The somewhat greater presence agriculture has in the District, however, does not make this region more rural than others in the nation. The proportion of the region's population that lives in rural areas is a more meaningful determinant of rural status. Not only does two-fifths of the District's population live in nonmetropolitan areas, but this share also accounts for a whopping 23 percent of the nation's nonmetropolitan population. In comparison, the District is home to only 14 percent of all of the nation's residents.
District urban and rural areas also have higher population densities than their national counterparts. District metropolitan areas, for instance, have about 325 persons per square mile, while the national average is about 290 persons per square mile. The difference is even more dramatic in nonmetropolitan areas: 45 persons per square mile in the District versus 18 persons per square mile in the nation, or about 2½ times the density. This higher density makes the District's rural areas attractive to businesses because of the larger-than-usual labor pool from which to draw workers. This gives these areas relatively important role to play in the region's overall economy.
Rural Areas: Myths and Realities
Because rural areas are usually characterized by farming—an industry of dwindling importance in U.S. output—as well as a more tranquil lifestyle than that found in cities, a common perception is that they grow slower than urban areas. An examination of two different growth measures—employment and personal income—shows that, for the District, this perception has some validity. Growth rates in both payroll employment and per capita personal income have, in general, been slightly faster in metropolitan than nonmetropolitan areas, though the differences are often negligible.
Employment in District Rural Areas
Between 1974 and 1984, nonfarm payroll employment actually grew somewhat faster in the District's rural counties than in its urban counties.5 For the most part, however, employment growth in urban and rural areas was slow, averaging about 1 percent a year during the decade. Individual states, however, differed in their growth patterns. For example, all District states except Illinois and Indiana had average job growth of more than 1 percent a year. Illinois and Indiana, which are in the Rust Belt, an area that suffered severe setbacks during this time, experienced employment growth that was about half a percentage point below the District norm in both urban and rural areas. Only in Kentucky and Missouri did rural areas create more jobs than urban areas.
By the mid-1980s, the resurgence of job growth in the region was obvious. The District's average growth rates were up a full percentage point from the previous decade. Arkansas, Mississippi and Tennessee—states in the southern part of the District which generally have lower labor costs due to less unionized labor forces, right-to-work laws and lower taxes—rebounded with stronger growth in both urban and rural areas. In all District states except Missouri, however, urban employment growth rates still outpaced rural ones, with some approaching 3 percent a year.
Manufacturing as a Driving Force
What sustained job growth during the leaner mid- to late-1970s and drove much of the resurgence that followed? As the charts below show, between the mid-1970s and mid-1980s, manufacturing employment levels fell in all District metropolitan areas, except those in Arkansas. This isn't too surprising since manufacturing's share of total employment has been declining nationally for decades, with some of the biggest hits taken in the 1970s.
Manufacturing Employment Growth
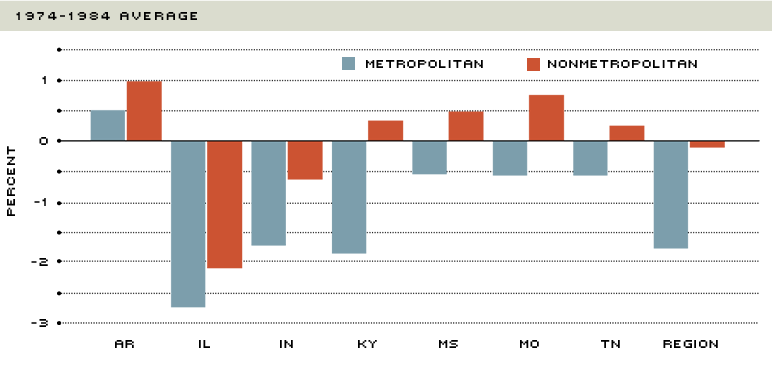
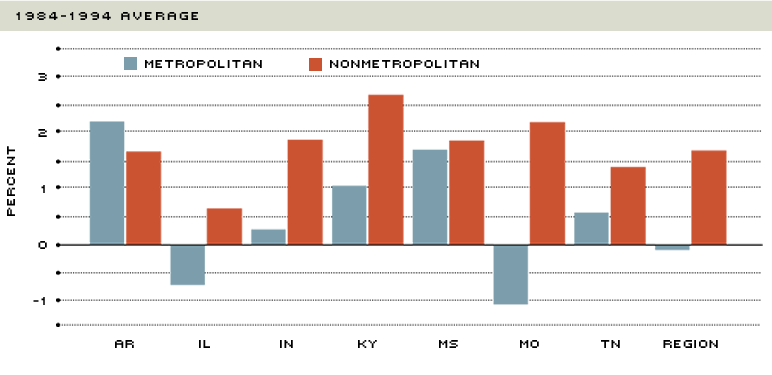
NOTE: Several small nonmetro counties in Arkansas, Illinois, Kentucky and Missouri are not included for some years.
SOURCE: U.S. Department of Commerce, Bureau of Economic Analysis
What is surprising, though, is that manufacturing employment levels in most states' nonmetropolitan areas actually increased during this period. Only in the Rust Belt states did they decline. Thus, while almost all District urban areas were losing manufacturing jobs, the bulk of District rural areas were creating them. One explanation for this is better access to transportation from improved rural highways. Although growth rates in rural areas were admittedly low—less than 1 percent a year—the mild growth served to set the stage for the coming resurgence.
From the mid-1980s to the mid-1990s, manufacturing employment took off in all District states' rural areas, even those in the Rust Belt. Kentucky and Missouri, in fact, experienced an average growth rate of more than 2 percent a year. Although most states' urban areas also added manufacturing jobs during this time, they came at a slower pace than in rural areas.
Overall, many more counties added manufacturing jobs than lost them. About twice as many District urban counties had some manufacturing employment growth than had some decline. But about four times as many District rural counties experienced manufacturing employment growth as experienced declines over the period.
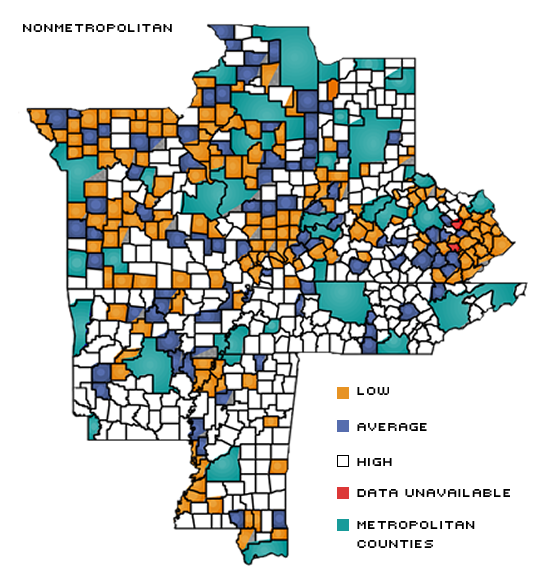
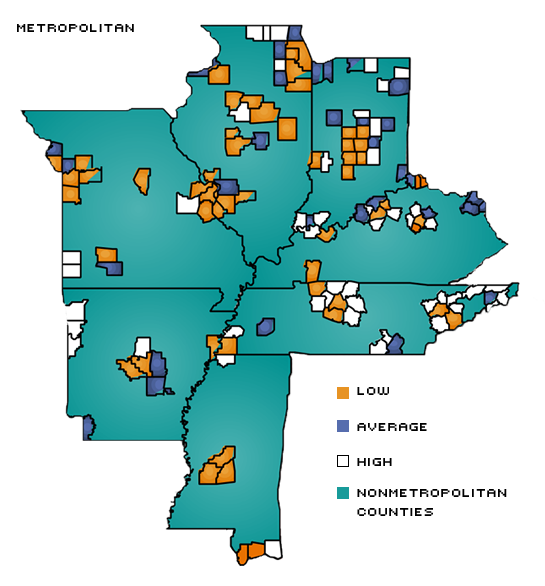
Where did the strongest growth occur? The maps below show those counties where average growth either increased or declined by more than 5 percent a year during the past 10 years. Only one District metropolitan county falls into the decline category, while about 30 percent of those that grew, did so at more than 5 percent a year.
Manufacturing Employment Success Stories (and Failures)
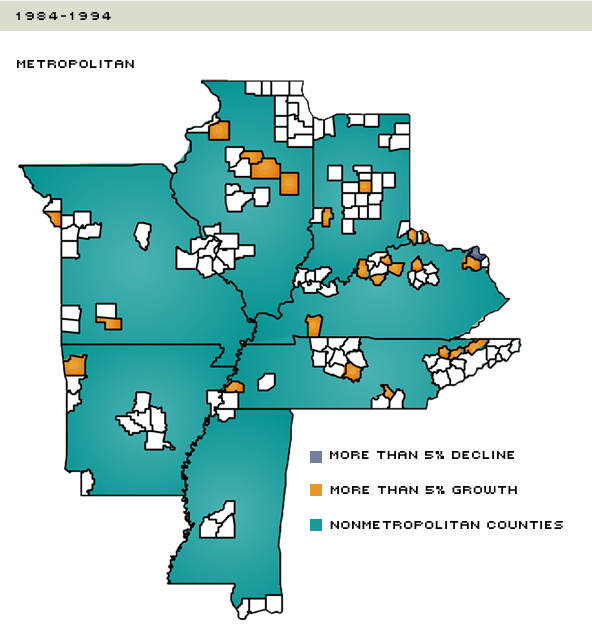
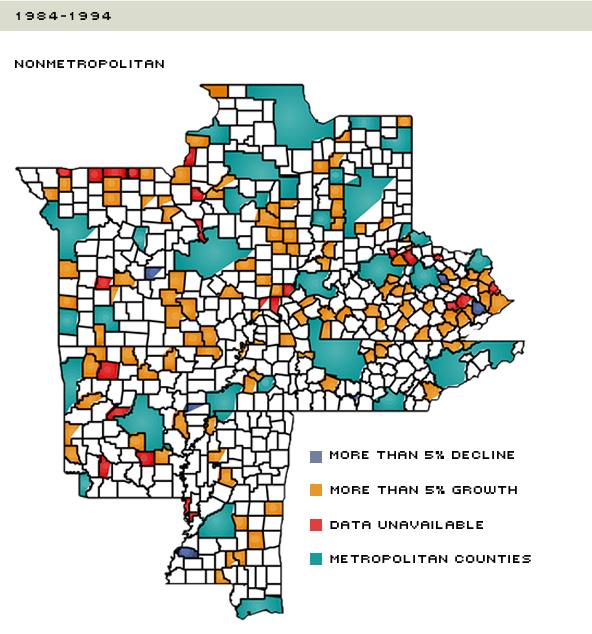
SOURCE: U.S. Department of Commerce, Bureau of Economic Analysis
The split among nonmetropolitan counties follows a similar pattern. Only six rural counties witnessed a decline in manufacturing employment of more than 5 percent a year over the period. Here, too, almost 30 percent of those counties that grew did so by more than 5 percent, illustrating that they were not only adding manufacturing jobs during the decade, but also holding their own against their urban neighbors. This is significant since manufacturers had usually favored urban areas because of their better access to labor, transportation, financing and an established corporate community.
The North/South Divide
About 17 percent of all current District employees work for manufacturing firms—marginally more than the 16 percent nationwide. Somewhat surprisingly, District nonmetropolitan counties have the higher concentrations of manufacturing workers—about 23 percent in nonmetropolitan counties compared with 15 percent in metropolitan counties. Both the nonmetropolitan and metropolitan District shares are lower than they were 10 years ago—four percentage points in the metro areas, one percentage point in nonmetro areas.
As the figure below shows, the nonmetropolitan counties in Arkansas, Mississippi and Tennessee are especially manufacturing intensive—more than 20 percent of all employees in these counties work for manufacturing firms. Nonmetropolitan counties in the northern states of the District, particularly Missouri, Illinois and Kentucky, generally have average or below average shares of manufacturing employment.
Manufacturing Employment's Share of Total Employment–1994
SOURCE: U.S. Department of Commerce, Bureau of Economic Analysis
What, then, explains the north/south discrepancy in the District's manufacturing employment concentrations? For the most part, it exists because southern states generally have less restrictive labor laws and lower labor costs than their northern neighbors. In fact, average manufacturing wages in southern District states are about $3 an hour less than in northern District states. This has made southern states particularly attractive to firms looking to cut costs and improve efficiency, as increasingly fierce competition has evolved in domestic and foreign markets.
What about Income Growth?
Another measure of a region's prosperity is its personal income growth. Per capita personal income measures the average level of income per person. Between 1974 and 1984, real per capita income (adjusted for inflation) in the District grew slightly less than 1 percent a year. The Rust Belt states exhibited the slowest growth, while increases in Arkansas, Missouri and Tennessee exceeded the District norm. Only in Mississippi and Tennessee did rural per capita income grow faster than urban.
By the mid-1980s, growth in per capita income accelerated in nearly all District states—in some cases by almost one percentage point a year. However, very few District counties experienced income growth of more than 3 percent a year during the period— only 6 percent of all rural counties, mostly in the southern states, and no urban counties. Even fewer had declines in income. Thus, just about all counties experienced average growth, regardless of whether they were rural or urban.
A clear urban/rural distinction exists in the level of per capita income among District counties, though. Metropolitan counties are, for the most part, wealthy; nonmetropolitan counties, particularly those in the southern states, are mostly poor. As a result, rural areas still have problems they haven't yet overcome, which, if not addressed, will restrain their prospects for future growth. The income disparity with their urban neighbors, and its resultant poverty, is one of their most prevalent problems.
Prevalent Poverty
District rural counties, especially in the south, have the region's highest concentrations of poor people. In fact, about 40 percent of these counties had more than 21 percent of their populations living below the poverty line in 1989.6 In contrast, most District metropolitan counties had less than 14 percent of their populations living below the poverty line.
Given the amount of poverty that exists in District rural counties, and the fast income growth experienced by some of these counties in the late 1980s and early 1990s, one might suspect that increases in government payments to the poor may have driven some of the growth. In fact, they did. Between 1984 and 1994, per capita government payments, adjusted for inflation, grew about half a percentage point a year faster in each state's rural areas than in its urban areas.
A Bit Older and Wealthier
Certainly, though, these payments were not all going to those in poverty. In 1994, only 11 percent of all federal government transfer payments went to welfare programs, while 70 percent went to Social Security and Medicare. Perhaps, then, most of these transfer payments were not going to those in poverty, but rather to those receiving Social Security and Medicare. The evidence supports this.
The rural areas of all seven District states have a larger share (15 percent) of their population in the 65 and older age group than their urban neighbors (12 percent). Although this pattern holds true for each District state, it is most pronounced in Arkansas, Illinois and Missouri.
Rural regions likely benefit from the larger presence of this age group because its members not only receive a steady stream of income and services from the government, but they also have accumulated wealth, which they're willing to spend. As a matter of fact, a recent economic study found that the Social Security and Medicare programs, for example, have enabled senior citizens to spend savings that otherwise would have been kept for medical emergencies or other necessities.7 This has allowed them to become some of the biggest spenders in the economy today, which probably bodes well for the future of rural areas.
What's in Store for These Regions?
Despite popular misconceptions, District rural areas have not been left behind over the past two decades. In fact, they have generally fared as well as, or better than, their urban neighbors. Although some of the growth could be a spillover from urban revitalization projects, many rural areas have exhibited income growth that's at least comparable to, and employment growth that's stronger than, their urban counterparts.
Moreover, rural areas have diversified their economies away from agriculture, which represents just a minuscule portion of total output today. Manufacturing is one sector that has been instrumental in this diversification. Nonmetropolitan counties are now some of the District's most manufacturing-intensive areas. Large pools of labor and better access to transportation have helped rural regions attract these businesses away from cities.
The next wave of development will likely arise from pathbreaking telecommunications technologies. A recent General Accounting Office report argues that while improved roads were once seen as the key to "rural areas' overcoming the barrier of distance, ... telecommunications technologies may [now] be a critical element in many rural areas' efforts to maintain and foster social and economic development."8 The belief is that these technologies will better link rural areas with other communities and their expertise, thereby improving medical services, creating new jobs and increasing access to educational opportunities.
Because firms that specialize in information technology and services, which will probably lead the economy in future growth opportunities, can essentially locate themselves anywhere, lower-cost areas will be the most attractive. If per capita income continues to grow as it has for the past 10 years, then rural areas, especially in the southern parts of the District where business costs are lower, can expect to see even more development than they have already.
Endnotes
- The terms "urban" and "metropolitan," and "rural" and "nonmetropolitan" are not strictly
synonymous; however, they will be used interchangeably in this article. "Metropolitan areas" refer to metropolitan statistical areas and consolidated metropolitan statistical areas, as defined by the U.S. Office of Management and Budget. [back to text] - See Zaretsky (1994) for a more detailed description of these incentives. [back to text]
- See Cooper and Sigalla (1996) for a description of how technological advances have made agriculture more productive and efficient. [back to text]
- The region includes Arkansas, Illinois, Indiana, Kentucky, Mississippi, Missouri and Tennessee. Although the Eighth Federal Reserve District does not cover all of these states in their entirety, this article will refer to whole states in its analysis. [back to text]
- Farm employment, which is not included in payroll employment data, declined in all areas during 1974-1984 and 1984-1994. It represents a very small fraction of total employment, however. [back to text]
- The cutoff of 21 percent is used because one-third of District counties had more than this share of their populations living in poverty in 1989. [back to text]
- See Gokhale and others (1996). [back to text]
- See U.S. General Accounting Office (1996), p. 1. [back to text]
References
Cooper, J.B., and Fiona Sigalla. Agriculture, Technology and the Economy, Federal Reserve Bank of Dallas (Fall 1996).
Drabenstott, Mark, and Tim R. Smith. "The Changing Economy of the Rural Heartland." Economic Forces Shaping the Rural Heartland, Federal Reserve Bank of Kansas City (April 1996), pp. 1-11.
Gokhale, Jagadeesh, Laurence J. Kotlikoff, and John Sabelhaus."Understanding the Postwar Decline in U.S. Saving: A Cohort Analysis." Brookings Papers on Economic Activity, no. 1 (1996), pp. 315-407.
Morgan, Kathleen O'Leary, Scott Morgan, and Neal Quinto. State Rankings 1996: A Statistical View of the 50 United States, 7th ed. Morgan Quinto Press (1996).
Smith, Tim R. "Determinants of Rural Growth: Winners and Losers in the 1980s," Research working paper, RWP 92-11, Federal Reserve Bank of Kansas City (December 1992).
U.S. General Accounting Office. Rural Development: Steps Toward Realizing the Potential of Telecommunications Technologies, GAO/RCED-96-155 (June 1996).
Zaretsky, Adam M. "Are States Giving Away the Store?" The Regional Economist, Federal Reserve Bank of St. Louis (January 1994), pp. 5-9.
Views expressed in Regional Economist are not necessarily those of the St. Louis Fed or Federal Reserve System.
For the latest insights from our economists and other St. Louis Fed experts, visit On the Economy and subscribe.
Email Us