


Can Agriculture Rebound This Year?
Last year was a daunting one for agriculture. Floods, excessive rainfall, freezes, drought and insects all combined to reduce farm output in 1993. These adverse effects, however, occurred unevenly across the United States, as some areas escaped relatively unscathed. Nevertheless, by late October more than 1,200 of all U.S. counties—almost 40 percent—were declared natural disaster areas. In 1991, these counties accounted for nearly 40 percent of the total value of U.S. agricultural production. Will some semblance of normalcy return to the Farmbelt this year, or will further challenges crop up?1
1993: What Goes Around Comes Around
Following the bumper crops of 1992, few believed that 1993 would be a repeat. Nevertheless, favorable moisture conditions throughout much of the Farmbelt early on raised expectations for an above-average year. Such expectations were dashed when persistent rainfall in the spring and early summer delayed plantings and flooded farmland. By August, the U.S. Department of Agriculture (USDA) was projecting marked reductions in yield and harvested acreage for most crops. The exception was cotton, which looked to be the second-largest crop on record. But with each subsequent crop report, the USDA became more pessimistic. By November 1, the USDA was projecting a 6.5 billion bushel corn crop, down 31 percent below the record 1992 crop. Likewise, it estimated soybean production at 16 percent below and rice production 9.5 percent below 1992's crops. Beset by insects, dryness and other maladies, cotton production was now expected to be up less than 1 percent from 1992. Because winter wheat was much less affected by weather in 1993, total wheat production was the same as 1992's relatively large crop.
Most District states felt the full impact of last year's calamities. Corn yields and harvested acreage, for example, were down substantially in all states—particularly in Missouri, where a 42 bushel per acre yield reduction, combined with a 650,000 acre reduction in harvested acreage pared 1993's crop by nearly half the previous year's. Except for Indiana, which harvested a record soybean crop, District soybean-producing states also suffered substantial reductions in output; this was mainly attributable to large reductions in harvested acreage, as yields were only marginally below the previous year's and, in Illinois, were actually larger than 1992's. In District cotton-producing states, production was down significantly across the board. Similarly, rice production fell considerably in the two largest rice-producing states—Arkansas and Mississippi.
Despite government intervention, commodity prices are generally determined by factors that affect supply and demand. Thus, reductions on the supply side in 1993 pushed prices upward for most District crops. At the beginning of 1993, for example, corn was trading near $2 a bushel; toward the end of the year it had risen to over $2.75 a bushel. Similarly, soybeans rose nearly a dollar a bushel from the end of 1992 to the end of 1993. Cotton prices, on the other hand, traded within a narrow band for much of 1993, while rice prices, except for substantial increases in the last three months of 1993, trended downward. Farmers whose crops were not adversely affected in 1993 thus benefited from the upward movement in commodity prices.
The table presents recent inflation adjusted farm income numbers and the USDA's forecasts for this year. There are two primary measures of farm income: net cash income (NCI) and net farm income (NFI).2 Despite a modest decline in cash expenses and increased government payments, real NCI in 1993 is estimated at $47.4 billion, down slightly from 1992. Lower cash receipts for food and feed grains and oil crops (for example, soybeans) more than offset higher cash receipts for livestock. Because of a decline in farm inventories, however, real NFI is projected to fall from $40.1 billion in 1992 to $35.4 billion in 1993. In fact, farmers liquidating their grain stocks to take advantage of higher grain prices actually boosted cash crop receipts in 1993.
Farm Income
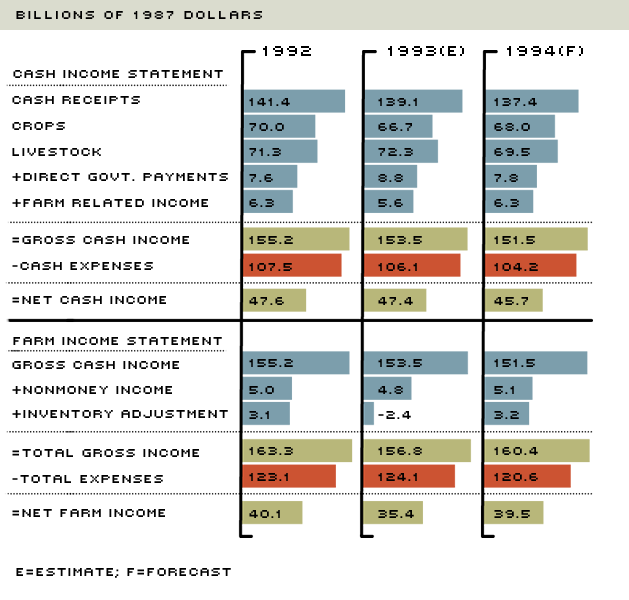
NOTE: Forecasts for 1994 represent the midpoint of the USDA's upper and lower bound estimate.
SOURCE: United States Department of Agriculture (December 1993)
The Outlook for 1994
The USDA expects farm output to increase 5 percent to 10 percent this year. But increases in output do not automatically translate into increases in income. To forecast farm income accurately, we must have some idea of expected future price movements. This is easier said than done because it involves predicting the supply and demand for farm commodities. Forecasting livestock production is much easier because production patterns typically do not change dramatically during the year. For example, the USDA expects another year of large meat supplies, with total production likely to expand by 3 percent over last year's record output. Much of this increase is due to a projected 5 percent increase in broiler production, which is near last year's increase. Beef production is expected to increase 3 percent to 4 percent, while pork production may decline slightly. Beef prices should thus decline slightly this year, while hog and broiler prices are expected to rise modestly. Catfish production, an increasingly important District industry, looks to remain near 1993 levels, but with slightly higher prices.
Forecasting crop output depends to a large extent on the weather, although the government can also influence crop size at the margin. Accordingly, the USDA expects an increase in farm output this year for two reasons. First, despite an El Niño alert by the National Weather Service in October 1993, the USDA assumes a "normal" weather pattern this year, boosting both crop yields and harvested acreage.3 Second, the Acreage Reduction Program (ARP) set-aside for wheat, corn, sorghum, barley and oats is zero percent.4 The USDA expects this policy to boost corn acreage by 3 million acres, leading to an increase in output of 225 million bushels. Moreover, a large fraction of the 8 million acres that were either flooded or not planted last year will be brought back into production this year. Although these developments would—all else equal—push crop prices downward, with corn and soybean stocks at their lowest levels in more than 15 years, this effect may be smaller than usual.
Demand for farm commodities, the other half of the price determination mechanism, depends on a myriad of factors, including the growth of population, livestock production and national income. Although most forecasters project the U.S. economy to grow by about 3 percent this year, many of our agricultural trading partners (for example, Japan, Western Europe and the former Soviet Union) are experiencing sluggish economic growth or outright recession. As a result, foreign demand for most farm commodities could be lackluster. Corn, cotton and soybean exports will also be hit by increased foreign competition. In fact, the USDA expects the U.S. global market share for soybeans and soybean meal to fall to 36 percent this year—a record low. Thus, tighter grain supplies, combined with projected increases in beef, pork and poultry production, may keep corn and soybean prices close to their 1993 year-end levels.
Prospects for rice and cotton are mixed. U.S. rice exports may rise considerably this year: Japan is once again expected to import foreign rice (although not necessarily from the United States), and world demand is forecast to rise. Rice prices are thus expected to average 80 to 95 cents a pound, about double the price that prevailed over much of 1993. U.S. cotton exports are estimated to have increased 13 percent in 1993 over 1992. But despite strong foreign demand, cotton exports are expected to slow markedly this year. Unless other factors come into play, cotton prices will probably continue in the 50 to 60 cents a pound range. In the long run, the passage of the North American Free Trade Agreement (NAFTA) and the successful completion of the General Agreement on Tariffs and Trade (GATT) will likely increase the demand for most U.S. agricultural products.
Taking all of these factors into account, the USDA expects real NCI to decline 3.6 percent this year to $45.7 billion (see table) because of lower livestock receipts and a net reduction in government payments. Because of a rebuilding of farm inventories, however, real NFI is expected to increase more than 11 percent this year to $39.5 billion. Increases in the value of farm inventories are expected to occur from both increases in farm output and higher average commodity prices. Given the tight supplies of several commodities, however, substantial market volatility could arise this year—particularly if adverse weather strikes again.
Endnotes
- This article summarizes the latest forecasts of the United States Department of Agriculture (USDA) presented at their annual Agricultural Outlook conference in December 1993. [back to text]
- Net cash income is gross cash income (including government payments plus other farm income) less cash expenses. Net farm income, on the other hand, includes noncash expenses such as depreciation and takes into account changes in inventories because many farmers store their grain after harvest in the hopes of selling it at higher prices later. [back to text]
- El Niño is a weather pattern thought to be caused by ocean warming and capable of producing extreme weather conditions across the globe. According to the USDA, El Niño could produce "continued saturated soils in the central and western corn belt with high potential for spring flooding on the Upper Mississippi and Lower Missouri Rivers, . . . , spring planting delays, and winter flooding in the southern Great Plains to the Delta regions." [back to text]
- An ARP stipulates a specific percentage of a farmer's land that must be set aside to qualify for government program payments. [back to text]

Views expressed in Regional Economist are not necessarily those of the St. Louis Fed or Federal Reserve System.
For the latest insights from our economists and other St. Louis Fed experts, visit On the Economy and subscribe.
Email Us