


The Foreign Demand for District Products
Exports have recently been a life preserver for the U.S. economy. According to the Economic Report of the President, real exports of goods and services grew 6.7 percent in 1991, a year in which real gross domestic product declined 0.7 percent and real government expenditures, the only other national income and product account to increase, grew 0.8 percent. Each state in the Eighth Federal Reserve District—Arkansas, Illinois, Indiana, Kentucky, Mississippi, Missouri and Tennessee—has benefited from the large demand for American exports. When one looks at economic conditions in the District, it is apparent that one of the reasons we've suffered less from the recent recession than many other areas is because of the variety of goods and services produced for export by District industries. In fact, almost every major industrial classification is represented in some area of the District. Despite this variety, the predominant exports in each state are strikingly similar, especially those from manufacturing firms.
Measuring State Exports
Concluding that a product was produced in the United States is relatively easy compared with determining the state in which it was produced. This is especially so because some data series attribute an export to the state from which it was shipped, even though it was produced elsewhere.
Compounding this problem is the two-month delay in the release of monthly export data. This delay translates into quarterly numbers being current only through the third quarter of 1992.
Additional difficulties arise because effective methods of tracking service exports from individual states have not yet been devised, even though services are exported daily. For example, each time Federal Express or United Parcel Service, both based in the District, provides international package delivery, it is exporting a service. If a District bank were to make a loan to a foreign firm, government or individual, the service provided by the bank to the borrower is also being exported. Likewise, when a telephone company connects an international call, it is exporting a service. The difficulty lies in quantifying such transactions; therefore, at the state level, we have information only from manufacturing, agricultural and natural resource industries.
Service exports are measured nationally, however, and such measurements show that services have become an increasingly important component of total exports. Real U.S. service exports (in 1987 dollars) increased from $72.3 billion in 1980 to $141.3 billion in 1991, a 95 percent increase. Over the same period, real U.S. merchandise exports increased from $248.2 billion in 1980 to $398.3 billion in 1991, a 60 percent increase. As a percent of total exports, service exports grew steadily from 22.6 percent in 1980 to a peak of 29.2 percent in 1987, before declining slightly to 26.2 percent in 1991.
Eighth District Exports: A Status Report
Among the District states, the top five exporting industries constitute between 59 percent and 78 percent of merchandise exports, with Tennessee and Indiana at the extremes, respectively. Transportation equipment, which includes automobiles, aircraft and much military equipment, is the leading export industry in most District states. This is not surprising because transportation equipment is the United States' leading manufacturing export. Two other prominent exporting industries in the District are 1) chemicals and 2) computers and industrial machinery. Some industries appear in the top five in only one District state: agricultural products (tobacco and livestock) in Kentucky, petroleum products in Mississippi, and scientific and measuring instruments in Illinois.
Final destinations for these products are also quite similar. The most frequent destination for District exports is Canada, the United States' largest trading partner. In fact, Indiana and Missouri report that almost 43 percent of their merchandise exports is shipped to Canada, about 10 percent more than the District average. Mississippi ships only 19 percent of its merchandise exports there, yet Canada is also Mississippi's most important foreign destination. Japan is the second most frequent trading partner for all District states except Kentucky, where it is third, and Missouri, where it is sixth. Other leading destinations include Germany, Mexico and the United Kingdom.
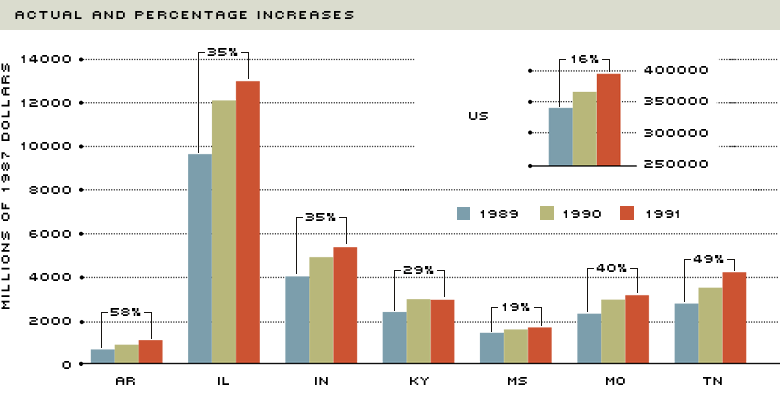
The growing importance of exports to the District states is illustrated in Chart 1. According to the chart, real merchandise exports in each state have increased between 1989 and 1991. The percentages show the increase in merchandise exports between these years. During this period, real merchandise exports increased only 16 percent in the United States. Even Mississippi, with the District's smallest percentage increase in real merchandise exports, increased its level more than the national average.
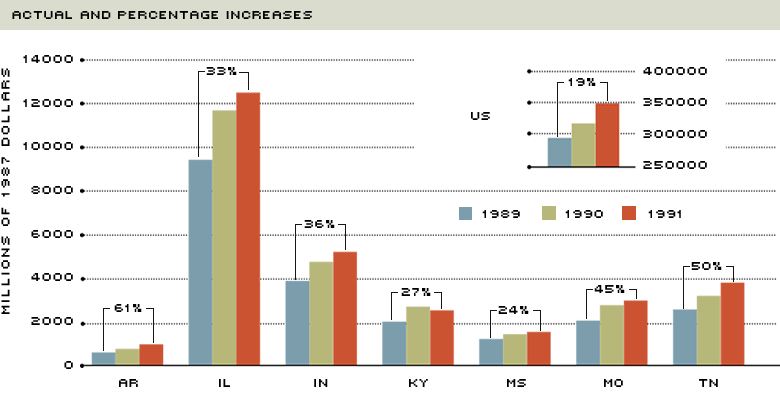
Chart 2 illustrates the levels of real manufacturing exports, which constitute the majority of merchandise exports, for the same three years. As the chart shows, each District state increased its level of real manufacturing exports by a greater amount (in most states, at least one and one-half times greater) than the U.S. average.
As these data demonstrate, exports have recently played an important role in the economies of the District states. Will this trend continue? For the first three quarters of 1992, the United States' cumulative level of merchandise exports was about 7.5 percent greater than the same level in 1991; each District state's differential was even larger, with 9.1 percent from Illinois being the District's smallest. Focusing only on manufacturing exports reveals the same scenario: The nation and all District states are above 1991's cumulative levels for the first three quarters of 1992, and Illinois, again with the District's smallest differential of 8.9 percent, is still greater than the national differential of 7.9 percent.
These numbers imply that in 1992 merchandise exports can potentially have an even greater share in output than they did in 1991. Whether the export boom will continue, especially as the District adapts to the further domestic adjustments expected in the defense and aerospace industries, remains to be seen. Nevertheless, as District industries realign themselves for global markets while the international economy integrates, additional and better foreign opportunities should arise, allowing the Eighth District to reap the benefits.
Real Merchandise Export by State
Real Manufacturing Exports by State
NOTE: Historical state-level data are available only through mid-1988.
Views expressed in Regional Economist are not necessarily those of the St. Louis Fed or Federal Reserve System.
For the latest insights from our economists and other St. Louis Fed experts, visit On the Economy and subscribe.
Email Us