


Which States Are Driving U.S. Employment Growth?
KEY TAKEAWAYS
- The 2020 CARES Act and subsequent legislation expanded unemployment insurance benefits for many Americans.
- States that chose to halt emergency benefits early have contributed significantly to national employment growth.
- Whether this trend intensifies or weakens remains to be seen, but it is likely to dissipate over time.
Beginning with the passage of the Coronavirus Aid, Relief and Economic Security (CARES) Act in March 2020, the federal government supplemented regular state unemployment insurance (UI) programs in several ways. It included an extension of benefits beyond regular state programs’ durations, eligibility extensions to workers who wouldn’t otherwise be covered by the state programs and an additional $600 per week. Since the passage of the CARES Act, further federal legislation has extended each of these, with the $600 weekly add-on reduced to $300. These emergency federal programs ended in early September.
In May and June, 26 states announced they would halt, or stop participating in, these emergency federal programs before September.Several of these states ended the $300 weekly add-on, but have continued to participate in other federal emergency UI programs. Also, there have been legal challenges to the cessation of these programs in a few states, with varying outcomes. Note that all these states have continued operating their regular state programs.
The Bureau of Labor Statistics (BLS) released data that measure the employment situation at the state level through the second week of July. These data allow analysts to look at the labor market performance of halting states and non-halting states as well as the labor market as a whole following the actions of halting states. Because some of the states terminating benefits enacted their policies right before or after the second week of July, I will focus my cross-state comparisons based on whether a state was an “early halter.”In a recent blog post, I show a major departure in continuing claims in regular state programs in halting versus non-halting states. I define early halters as the 12 states that terminated at least a portion of emergency federal benefits before June 25.
At the national level, employment in July (including for the self-employed and gig workers) as measured by the BLS Current Population Survey, grew by more than 1 million people over the preceding month. This was the first time this measure increased by more than 1 million since October 2020.
An Employment Growth Decomposition Using Household Survey Data
A natural question is how much of national employment growth was driven by early-halting versus other states.In the calculations that follow, I define the early halters as states that ended at least a portion of federal emergency UI benefits before June 25. They include Alabama, Alaska, Idaho, Indiana, Iowa, Mississippi, Missouri, Nebraska, New Hampshire, North Dakota, West Virginia and Wyoming. I group all the remaining states into the non-early halters. To answer this question, I partition this year’s monthly data into three subperiods of two months: two subperiods before the states’ policy announcements (January through March and March through May) and one subperiod after the policy announcement (May through July).In this article, all data are seasonally adjusted and July employment counts are preliminary.
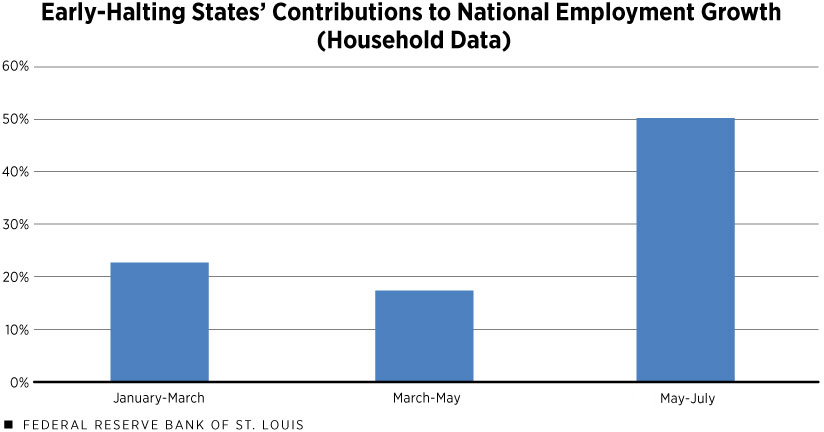
SOURCES: Bureau of Labor Statistics and author’s calculations.
For each of the subperiods, I compute the share of employment growth coming from the early-halting states. In the two subperiods before the announcement, the early-halting states contributed about 23% and 17%, respectively, to national employment growth. After the announcement (and including several weeks in which the benefits had ended), this share more than doubled to about 50%.
Thus, employment growth from early-halting states has become a relatively more important driving factor of national employment growth over the past two months and coincides with the UI policy change and its associated announcements.The calculation used to construct this figure is known as a decomposition analysis. It parses the observed growth into that coming from early-halting states versus other states. This type of analysis uses fewer assumptions than a counterfactual analysis, which tries to answer the question: What would have happened in the halting states had they not halted benefits? Answering this question requires making potentially non-innocuous assumptions, such as constructing a “pre-trend” path for employment in the period preceding the policy announcement. Moreover, it is well-known that the answer to this type of counterfactual question can depend critically on what exact assumptions one makes. This article’s decomposition avoids making these assumptions.
An Employment Growth Decomposition Using Establishment Survey Data
Whereas the calculation above is based on the household component, the BLS also reports jobs in the economy measured from the employer side using the Current Employment Statistics survey. This counts the total number of people on the payroll during the second week of the corresponding month’s data. Between the second week of May and second week of July, this employment measure increased by almost 2 million people. This reflects the strongest two-month growth of employment in the U.S. since fall 2020.
The second figure plots the corresponding growth decomposition using the employer-based, instead of household-based, worker counts. As with the household data, there is a marked increase in the contribution of the early-halting states. Early-halting states went from contributing about 18% to over 35% of all establishment-based jobs growth in the three months immediately preceding the policy change to the three months afterward.
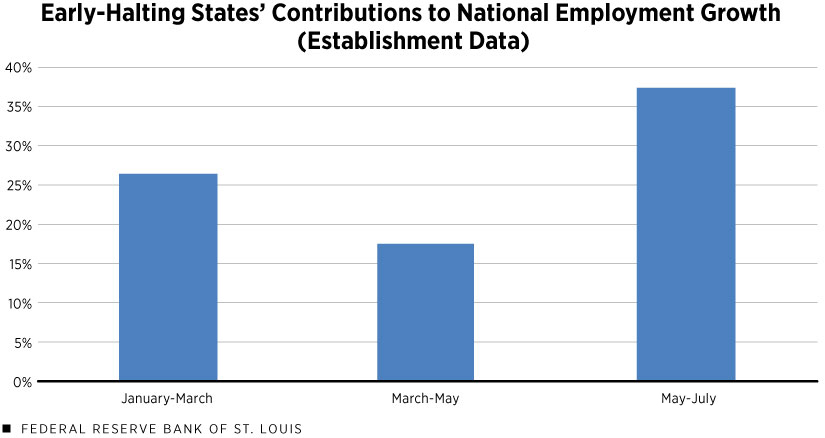
SOURCES: Bureau of Labor Statistics and author’s calculations.
One important drawback of the employment statistics survey is that it excludes self-employed and gig workers. Since many people collecting federal emergency benefits had been self-employed before their job separations, it stands to reason that many of the people returning to work would resume being self-employed. Thus, the calculations based on the employment statistics survey may undercount the total employment growth.
A Word of Caution
In this article, I have explained how early-halting states have become an increasingly important driver in the recent strong national employment growth, measured using either the household or employment statistics surveys. Whether these driving factors remain, intensify or weaken is an important and open question.
The answer to that question will likely be influenced by two things. First, the time between the halting states’ terminating benefits and the collection of the July employment data was three to four weeks. It may take additional time for people reentering the labor market to search, interview for and accept employment. Any differential effects on employment between states that ceased accepting benefits early and those losing benefits in September will likely dissipate over time.
Endnotes
- Several of these states ended the $300 weekly add-on, but have continued to participate in other federal emergency UI programs. Also, there have been legal challenges to the cessation of these programs in a few states, with varying outcomes.
- In a recent blog post, I show a major departure in continuing claims in regular state programs in halting versus non-halting states.
- In the calculations that follow, I define the early halters as states that ended at least a portion of federal emergency UI benefits before June 25. They include Alabama, Alaska, Idaho, Indiana, Iowa, Mississippi, Missouri, Nebraska, New Hampshire, North Dakota, West Virginia and Wyoming. I group all the remaining states into the non-early halters.
- In this article, all data are seasonally adjusted, and July employment counts are preliminary.
- The calculation used to construct this figure is known as a decomposition analysis. It parses the observed growth into that coming from early-halting states versus other states. This type of analysis uses fewer assumptions than a counterfactual analysis, which tries to answer the question: What would have happened in the halting states had they not halted benefits? Answering this question requires making potentially non-innocuous assumptions, such as constructing a “pre-trend” path for employment in the period preceding the policy announcement. Moreover, it is well known that the answer to this type of counterfactual question can depend critically on what exact assumptions one makes. This article’s decomposition avoids making these assumptions.

Views expressed in Regional Economist are not necessarily those of the St. Louis Fed or Federal Reserve System.
For the latest insights from our economists and other St. Louis Fed experts, visit On the Economy and subscribe.
Email Us