Anecdotal Evidence Suggests State Capacity Unrelated to COVID-19 Spread
KEY TAKEAWAYS
- Some countries have weathered the COVID-19 pandemic relatively well, while others have seen millions of cases and thousands of deaths.
- Wealthier nations with greater state capacities haven’t necessarily experienced the best outcomes.
- Anecdotal evidence suggests the actions taken (or not taken) by different governments may have a greater effect on containment than wealth does.

The COVID-19 pandemic has been a rigorous test of governance around the globe. Some countries have fared relatively well, stopping the spread of the pandemic by acting quickly and following scientific guidance. Others have waited too long to respond, or responded inadequately and have seen millions of cases and hundreds of thousands of deaths.
It could be expected that governments with higher state capacities would have better COVID-19 responses. State capacity is a concept used in economic literature to measure how effectively a government delivers services to its citizens. It is typically measured using indicators such as tax revenue percentage of gross domestic product (GDP), GDP per capita or perceptions of government effectiveness. In this article, we examine COVID-19 response as a potential revealed measure of state capacity and compare it to conventional measures of state capacity.
COVID-19 Outbreak Timeline
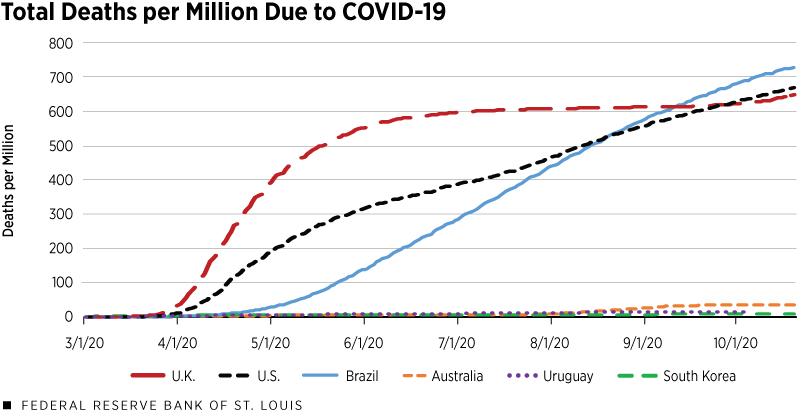
For our analysis, we used data on countries’ COVID-19 responses from the Oxford COVID-19 Government Response Tracker (OxCGRT), data on COVID-19 spread measures from Our World in Data and data on governance indicators from The World Bank’s World Development Indicators. The figure below shows the timeline of COVID-19 spread in three countries that had particularly effective responses—Australia, Uruguay and South Korea—and in three countries that did not—the U.K., the U.S. and Brazil.
On March 11, the World Health Organization declared COVID-19 to be a pandemic. There were very few COVID-19 deaths in these six countries at the time, with the highest being one total death per million in South Korea. But a little more than a month later, on April 15, the numbers changed dramatically. The growth rate of the pandemic in the U.K., the U.S. and Brazil shot up, leading to 208, 79 and seven deaths per million for the respective countries. Meanwhile, South Korea had started out with the highest numbers of deaths, its numbers had grown only to four total deaths per million by mid-April. At that time, Australia and Uruguay both had only two deaths per million.
By Oct. 1, there were 621 deaths per million in the U.K., 625 per million in the U.S. and 677 per million in Brazil. In South Korea, there were eight deaths per million, an increase of only four deaths per million since April 15. At the same time, there were 35 deaths per million in Australia and 14 deaths per million in Uruguay.
One difference in the COVID-19 responses among these countries was testing. In the U.S., the first kits produced were contaminated, leading to a delay in testing. By March 11, 40 tests had been performed per million people. At the same time, in South Korea, 4,338 tests had been performed per million people. By April 15, Australia surpassed South Korea in testing, at 14,564 tests per million people, while the U.S. performed 9,934 and the U.K. 6,105. Brazil performed 296 tests per million people, while Uruguay performed 3,008 per million.
The countries also differed in when they implemented social distancing policy measures such as canceling public events. In South Korea, cancelation of public events was recommended early, when the country had only seven cases. When the country had 155 cases, cancelation was required. In Australia, public event cancelation was required at 454 cases and in Uruguay before six cases. In contrast, the U.K. didn’t cancel public events until there were 6,481 cases in the country. The U.S. didn’t cancel until there were 1,312 cases.
COVID-19 Response as a State Capacity Measure
The experiences of these six countries, while anecdotal, suggest that government action may have impacted the spread of the COVID-19 pandemic. If this is the case, COVID-19 would be a potential revealed measure of a country’s state capacity in responding to national emergencies.
There are two schools of thought on how state capacity should be measured. Some scholars believe the best measures are measures of procedure (such as perceptions of government effectiveness) or measures of extractive capacity and resource levels (such as tax revenue as a percentage of GDP).Tax revenue percentage of GDP measures the ability of a government to extract taxes, along with the number of resources available to the government. Generally, low-income countries have a lower tax revenue percentage of GDP than high-income countries. Others argue that revealed measures—such as COVID-19 spread—can be useful as a complement to conventional state capacity measures.
State capacity is not an outcome in itself; it is important to citizens because it allows governments to provide services. Although revealed measures do not substitute for conventional state capacity measures, low measures of revealed state capacity for countries with high conventional state capacity may call conventional measures into question.
Critics of revealed measures of state capacity (notably Francis Fukuyama) have argued that they are not sufficiently linked to government action and are difficult to measure based on norms or preferences. However, it seems likely that government response was an important factor in the spread of the COVID-19 pandemic.
Although other factors affect COVID-19 spread (population age, density, cultural factors and previous pandemic experience), the same could be said for any other measure of state capacity. In terms of measurement, there are some differences in recording methodologies for COVID-19 deaths by country. However, these differences do not mask the differences in thousands of deaths between countries. Finally, preventing death and sickness is important to citizens of all governments and not a matter of preference.
Conventional State Capacity Indicators and COVID-19 Spread
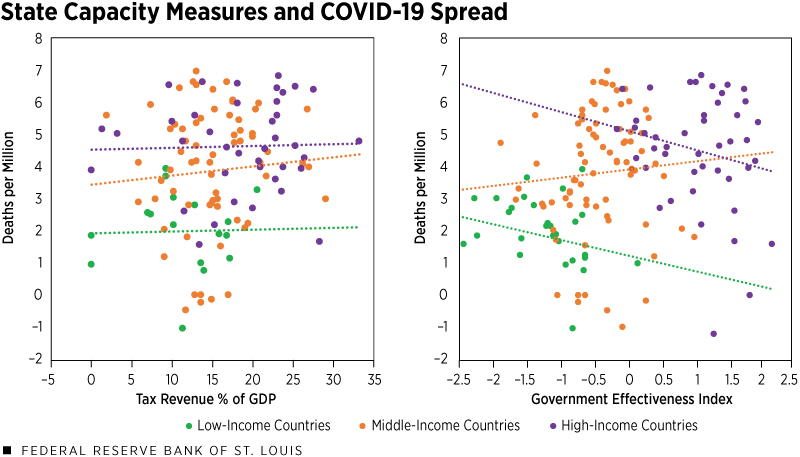
Figure 2 shows the relationship between two commonly used state capacity indicators (government effectiveness and tax revenue as a percentage of GDP) and a measure of COVID-19 spread (total deaths per million). The government effectiveness measure is an index constructed from 43 different indicators of:
- Perception of the quality of public services
- Quality of civil service and its independence from political pressures
- Quality of policy formulation and implementation
- The credibility of the government’s commitment to such policiesData from the 43 indicators are collected and rescaled to run from 0 to 1. Then, an unobserved-components model is used to make the data comparable across sources and to construct a weighted average of the individual indicators.
We would expect governments with higher state capacities to be more successful against the pandemic. Instead, there is no relationship between a government’s resource levels and the total number of coronavirus deaths. There is also no statistically significant relationship between the government effectiveness index and total deaths, although the graph shows a slight negative relationship in high- and low-income countries and a positive relationship in middle-income countries. High-income countries have had more deaths and cases overall, despite having more resources to combat the pandemic. Analysis for the total number of coronavirus cases shows similar results.Number of deaths is considered the more accurate measure of COVID-19 spread across countries because the number of cases depends heavily on testing rates.
If it is indeed the case that COVID-19 spread is a valid revealed measure of state capacity, these graphs suggest that either conventional measures are potentially biased or that state capacity in previously effective governments has deteriorated. How is it possible that higher-income countries with more effective governments, more resources and more advanced medical technologies could perform no better during COVID-19?
Further analysis is needed to understand why conventional state capacity measures do not seem to be good predictors of COVID-19 spread. As the pandemic continues into the winter, hopefully countries will improve their capacity to control the spread of COVID-19.
Endnotes
- Tax revenue percentage of GDP measures the ability of a government to extract taxes, along with the number of resources available to the government. Generally, low-income countries have a lower tax revenue percentage of GDP than high-income countries.
- Data from the 43 indicators are collected and rescaled to run from 0 to 1. Then, an unobserved-components model is used to make the data comparable across sources and to construct a weighted average of the individual indicators.
- Number of deaths is considered the more accurate measure of COVID-19 spread across countries because the number of cases depends heavily on testing rates.
Views expressed in Regional Economist are not necessarily those of the St. Louis Fed or Federal Reserve System.
For the latest insights from our economists and other St. Louis Fed experts, visit On the Economy and subscribe.
Email Us


