


Measuring Levels of Debt in the Eighth District’s Key Metro Areas
KEY TAKEAWAYS
- Debt growth slowed in both the U.S. and the Eighth District from the first quarter of 2018 to the second.
- Mortgage debt growth in Eighth District MSAs has been declining recently, and delinquency rates for mortgage debt have started to decline.
- Overall, the data do not seem to indicate that a severe debt problem may be brewing.

In a prior Regional Economist article, we introduced data that can be used to evaluate consumer debt developments in the Eighth District.Headquartered in St. Louis, the Eighth Federal Reserve District includes all of Arkansas and parts of Illinois, Indiana, Kentucky, Mississippi, Missouri and Tennessee. The Federal Reserve Bank of New York’s Consumer Credit Panel (CCP) is based on an anonymized 5 percent sample of credit files provided by the credit monitoring company Equifax. In this article, we once again used the CCP to develop statistics that can be used to monitor auto, credit card and mortgage debt, as well as home equity lines of credit (HELOCs).
Rather than focusing on developments in the Eighth District, however, we decided it would be potentially more useful to aggregate debt statistics to the city level. Hence, this article reports on consumer debt levels by type of debt for the largest metropolitan statistical areas (MSAs) in the District: St. Louis; Memphis, Tenn.; Louisville, Ky.; and Little Rock, Ark.
National and Eighth District Developments
Table 1 presents the inflation-adjustedWe express all debt adjusted for inflation using the personal consumption expenditures chain-type price index. growth in consumer debt for the U.S. and the Eighth District in the most recent quarters for which data are available.
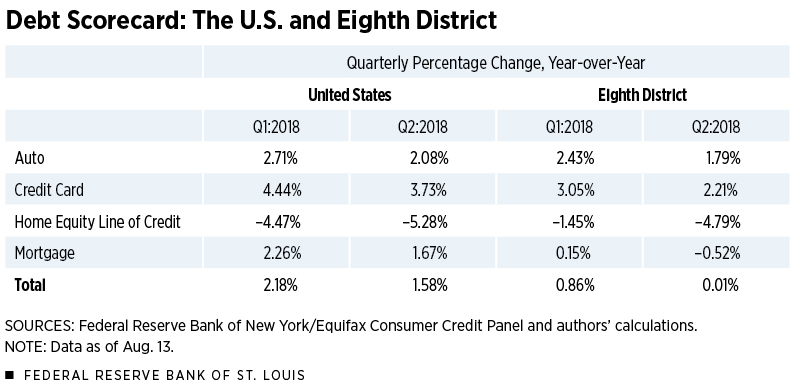
As can be seen, all categories of debt growth slowed in both the U.S. and the Eighth District from the first quarter of 2018 to the second. Nationally, total consumer debt grew by 1.58 percent in the second quarter. In the Eighth District, total consumer debt showed almost no growth.
Auto debt—which had been rising quickly enough in 2017 to create some concern in the popular press—seems to have slowed. The decline in mortgage debt growth, especially in the Eighth District, suggests a slowing housing market.
Eighth District MSAs
While district-level data may be of interest, data allowing trends to be observed at the MSA level are likely more useful for private interests and public policymakers. In this section, we report overall consumer debt developments for Little Rock, Louisville, Memphis and St. Louis. The data are constructed from the CCP by building individual records into representations of household debt and matching them to MSAs.
In general, the MSA growth rates displayed the same patterns as those observed in the nation. The growth in total debt fell for all areas during and after the Great Recession. It was not until 2014 that total consumer debt began to increase once again in most MSAs.
Little Rock tended to have higher debt growth rates compared with those of other MSAs from 2008 until 2015. Total debt growth in Memphis and St. Louis, by contrast, has been below that observed nationally for most of the last decade.
In Figure 1, these trends in real consumer debt are broken down by category.
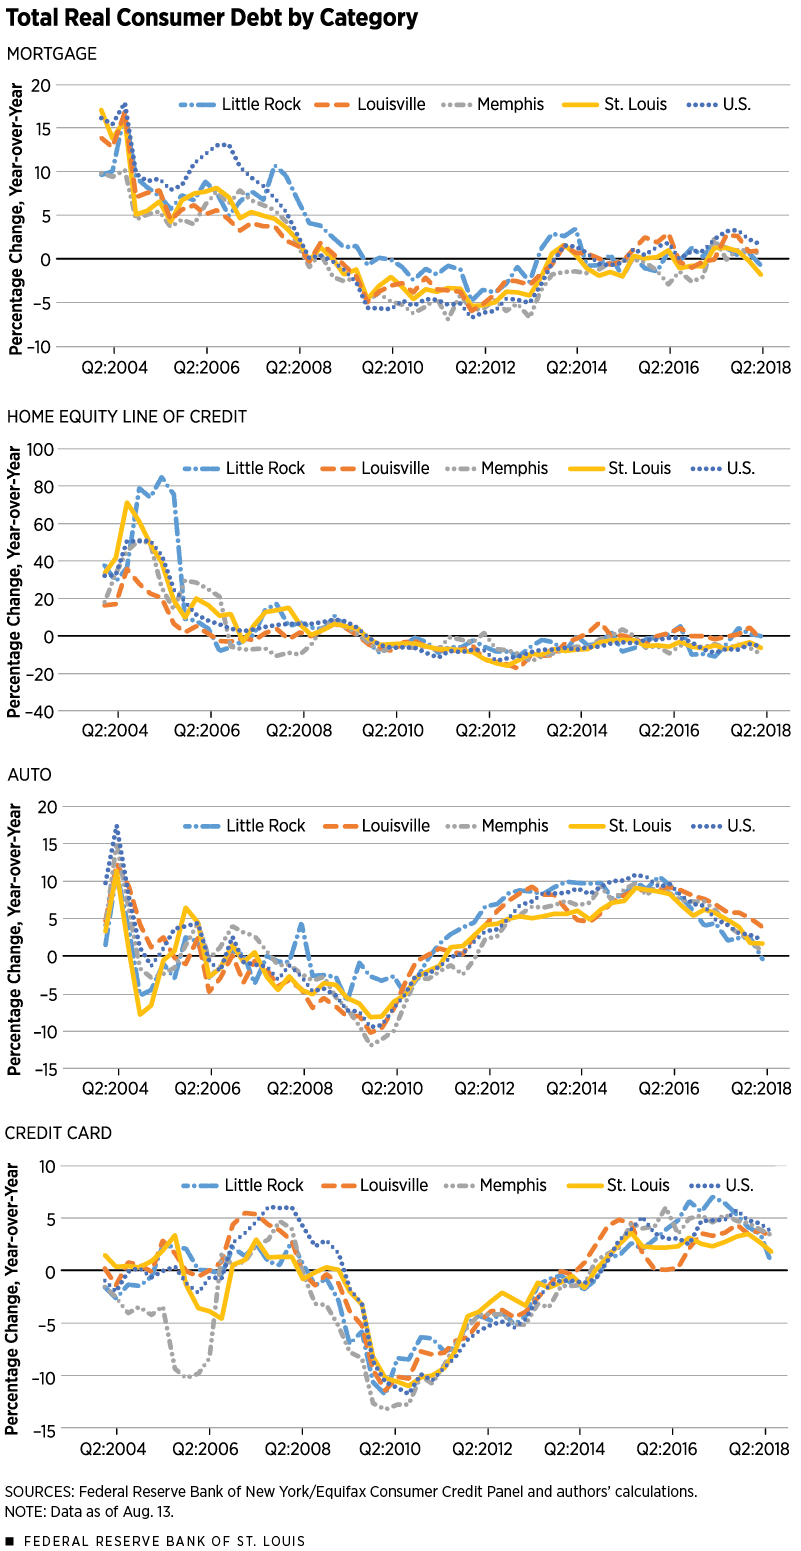
In each of the included cities, the growth in mortgage debt has been beneath the national average for several quarters. St. Louis and Little Rock have actually seen a net decrease in mortgage debt. As mentioned previously, this is likely caused by a slowing mortgage market.
HELOC debt growth also declined in each MSA during the second quarter of 2018, with Memphis experiencing the largest decline. Auto debt growth was quite strong until 2016. After that point, however, auto debt growth began to slow in most of the MSAs.
Table 2 offers a focused view of the first two quarters for the current year, showing that auto debt in Louisville, Memphis and St. Louis all grew in the modest range of 0.46 percent to 3.82 percent in the second quarter. Little Rock was an outlier as auto debt actually declined slightly. These data may suggest some slowing in auto sales during the second quarter of 2018.
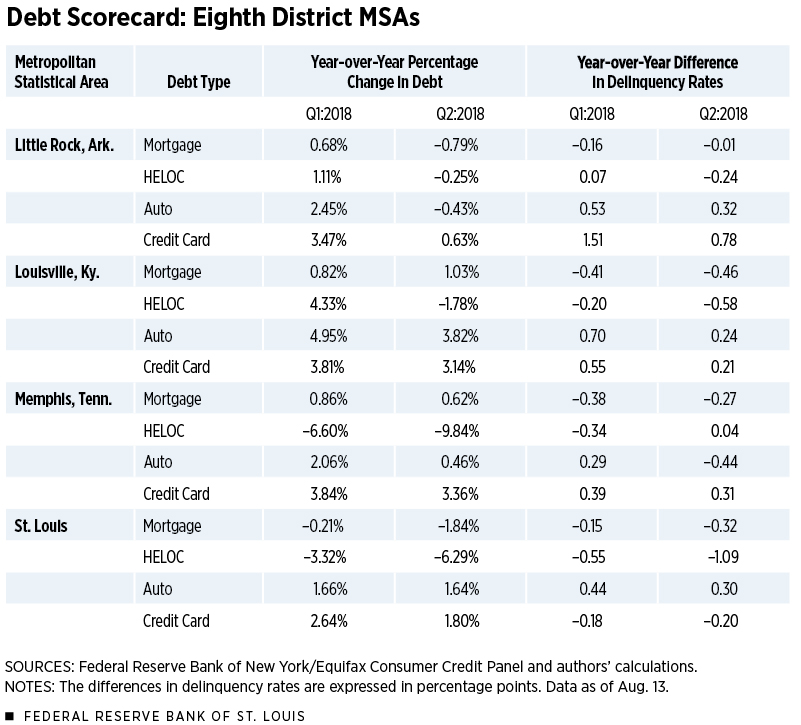
Accumulation of credit card debt seems likewise to be slowing across all MSAs more so than the national average. Generally, the MSA-level data track closely with national data for each component in terms of year-over-year growth.
When Do Debt Increases Signal a Problem?
An increase, or even a sustained increase, in any debt category does not necessarily signal a problem as long as debtors continue to demonstrate an ability to repay. To provide clarity, then, we also monitored 90-day delinquency rates in each MSA by debt category.The 90-day delinquency rate is found by dividing the volume of loan payments 90 or more days past due by the total volume of loan payments. The idea is that increasing both consumer debt and corresponding delinquency rates could signal a possible debt problem.
Table 2 also shows the difference between each quarter’s delinquency rate and the corresponding rate of the same quarter a year ago. If these rates were compared to the growth in delinquency rates that occurred just prior to the Great Recession, one would see that current rates for each debt category are substantially smaller.
As can be seen in Table 2, the delinquency rates for MSAs in the HELOC and mortgage categories declined during each of the last two quarters in all but two cases. The other categories defy a consistent story, but delinquency rates were well below Great Recession levels with two exceptions: credit card delinquencies in Little Rock and auto delinquencies in Louisville.
Overall, the data do not seem to indicate that a severe debt problem may be brewing.
Endnotes
- Headquartered in St. Louis, the Eighth Federal Reserve District includes all of Arkansas and parts of Illinois, Indiana, Kentucky, Mississippi, Missouri and Tennessee.
- We express all debt adjusted for inflation using the personal consumption expenditures chain-type price index.
- The 90-day delinquency rate is found by dividing the volume of loan payments 90 or more days past due by the total volume of loan payments.
References
Eubanks, James D; and Schlagenhauf, Don E. Gauging Debt Levels in the U.S. and Eighth District. Regional Economist, Second Quarter 2018, Vol. 26, No. 2, pp. 19-21.


Views expressed in Regional Economist are not necessarily those of the St. Louis Fed or Federal Reserve System.
For the latest insights from our economists and other St. Louis Fed experts, visit On the Economy and subscribe.
Email Us