Slowdown in Productivity: State vs. National Trend
Slow growth in labor productivity is one of the major challenges facing the U.S. economy. Not surprising, then, is the level of attention being drawn to the problem.1 However, there is no consensus on the slowdown's cause, with multiple contributing factors being likely.
This article takes a step to investigate the issue by looking at the labor productivity growth rate at the state and regional levels. More specifically, we explore the trends in state and regional labor productivity growth over the current and previous expansions to see how growth has varied both geographically and over time.2 The aim is to see whether the labor productivity slowdown observed in the national data occurred homogeneously across states or if some states played a larger role than others.
Background
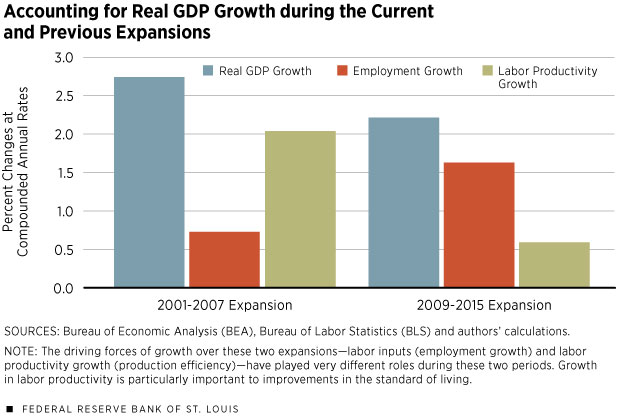
The average growth rate for gross domestic product (GDP) in the nonfarm business sector3 since the end of the financial crisis in 2009 has been slow, an annual rate of only 2.2 percent. In the previous expansion, which ran from 2001 to 2007, the economy grew at an annual rate of 2.8 percent. The driving forces of growth during these two expansions—labor inputs and production efficiency—have played markedly different roles.
Figure 1 shows real GDP growth decomposed into employment growth and labor productivity growth, measured here as growth in output per employee.4 Over the 2001-2007 expansion, growth in labor productivity was the key driver of economic growth; it grew 2.1 percent annually and accounted for nearly 75 percent of real GDP growth. Over the current expansion, growth in labor productivity has been very low, only 0.6 percent annually, accounting for just 26 percent of real GDP growth.
The weak labor productivity growth is a much deeper concern than even the lower aggregate economic growth rate: Labor productivity growth is the key factor that increases per capita standard of living since it measures the average growth rate of the amount of goods and services that each individual can consume.
More importantly, a small difference in labor productivity growth leads to a dramatic difference in the standard of living in the long run. For example, if the labor productivity growth rate held steady at 2.1 percent—the rate seen in the previous expansion—the living standard would double in only 33 years. If labor productivity continues to grow at 0.6 percent—the rate of growth in the current expansion—the living standard would improve by just 22 percent over the same 33 years.
Growth over Geography and Time
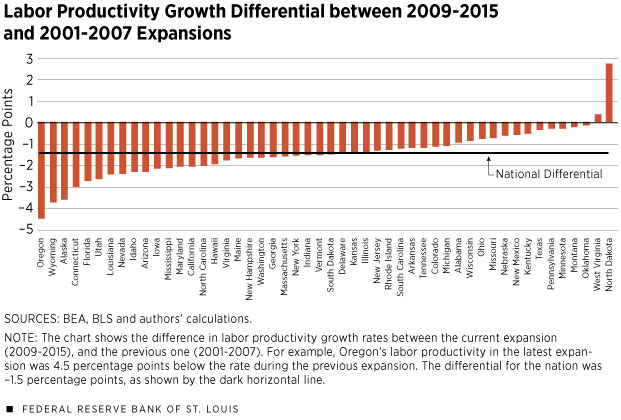
A comparison of the state-level labor productivity growth between the current and previous expansions shows that the slowdown has been experienced by most states and, hence, is a nationwide phenomenon. Figure 2 provides the supporting evidence. It plots the differential between average labor productivity growth in the current and previous expansion periods for each state. The horizontal line in Figure 2 is the labor productivity growth differential for the nation, coming in at –1.5 percentage points.
Turning to the states, only two, North Dakota and West Virginia, saw labor productivity grow faster over 2009-2015 than 2001-2007. A significant oil boom began in North Dakota in the mid-2000s, bringing a large influx of capital; West Virginia saw only a marginal increase.
Over the current expansion, a total of 13 states experienced negative growth, averaging –0.5 percentage points. In the previous expansion, 23 states averaged labor productivity growth at or above 2 percent, and no state averaged negative growth.
For some states, the housing crisis may be a major contributor to their slowdown in productivity growth. States that experienced a large housing boom during the previous expansion have seen a bigger decrease in labor productivity than the national average. For example, California, Nevada, Arizona and Florida each had more than a 2 percentage point differential in labor productivity growth between the two expansions. Some states in New England also had a significant housing bubble along with higher than average productivity reductions; these states included Connecticut, Massachusetts, New Hampshire and Maine. It is, thus, not surprising that the average differential was the largest in the Far West (–2.8 percentage points), the Rocky Mountains (–2.0 percentage points) and New England (–1.8 percentage points) and the smallest in the Plains (–0.6 percentage points).5
In addition to there being a nationwide drop in labor productivity growth over time, there has been a significant amount of geographic variation in the productivity growth. During the previous expansion, it was fastest in Oregon at 4.3 percent and slowest in West Virginia with an average annual growth rate of just 0.7 percent. There were also significant variations at the regional level: Average labor productivity growth was fastest in the Far West (2.6 percent), the Plains (2.2 percent) and New England (2.1 percent); it was slowest in the Mideast (1.7 percent), Southeast (1.8 percent) and Southwest (1.8 percent).
The cross-sectional growth heterogeneity remains intact in the current expansion. Labor productivity grew fastest in North Dakota, averaging 5 percent, and second-fastest in Oklahoma, averaging 2.2 percent. The boost of labor productivity of these two states is very likely associated with the boom of the oil industry.
Some regions still fared better than others: Average growth was fastest in the Plains (1.6 percent), Great Lakes (0.8 percent) and the Southwest (0.6 percent). The other regions averaged growth that was near zero, with the Far West actually averaging negative growth (–0.1 percent).
Conclusion
We found that the labor productivity slowdown has been a widespread national phenomenon. This suggests that the main cause is a national rather than regional factor. However, we also found that the boom and bust of the housing market in some regions and states may have played a role in explaining why some states experienced a deeper drop in productivity growth than others.
YiLi Chien is an economist and Paul Morris is a research associate, both at the Federal Reserve Bank of St. Louis. For more on Chien’s work, see https://research.stlouisfed.org/econ/chien.

Endnotes
- See Blinder, Irwin and Leubsdorf for examples of newspaper articles. [back to text]
- Although the U.S. expansion continues today, state and regional data available to us for this study only go through 2015. [back to text]
- The nonfarm business sector is the standard sector used by the Bureau of Labor Statistics (BLS) in its labor productivity analysis. As defined by the BLS, the nonfarm business sector—excludes general government, private households, nonprofit organizations serving individuals, and farms—and accounted for approximately 77 percent of total GDP in 2000. For this article, we approximated this sector by using GDP and employment data of the total private sector excluding farms. [back to text]
- We measured labor productivity using output per employee rather than the traditional measure of output per hour used by the BLS because hours data are not available at the state level for all of the years in our sample. [back to text]
- We used the regions delineated by the Bureau of Economic Analysis at www.bea.gov/regional/docs/regions.cfm. [back to text]
References
Blinder, Alan. "The Mystery of Declining Productivity Growth." The Wall Street Journal, May 14, 2015. See www.wsj.com/articles/the-mystery-of-declining-productivity-growth-1431645038.
Irwin, Neil. "Why Is Productivity So Weak? Three Theories." The New York Times, The Upshot, April 28, 2016. See www.nytimes.com/2016/04/29/upshot/why-is-productivity-so-weak-three-theories.html?_r=0.
Leubsdorf, Ben. "Productivity Slump Threatens Economy's Long-Term Growth." The Wall Street Journal, Aug. 9, 2016. See www.wsj.com/articles/u-s-productivity-dropped-at-0-5-pace-in-the-second-quarter-1470746092.
Views expressed in Regional Economist are not necessarily those of the St. Louis Fed or Federal Reserve System.
For the latest insights from our economists and other St. Louis Fed experts, visit On the Economy and subscribe.
Email Us


