


Financial Conditions: Do the Ups and Downs Affect the Rest of the Economy?
This article discusses two related questions. First, how can we measure financial conditions? To answer this question, we present information about our preferred measure of financial conditions: financial conditions indexes. We discuss how they are constructed and show their recent evolution.
Once we explain how financial conditions can be summarized in an index, we move to our main question: How do financial conditions affect real activity? This question is more challenging because improvements in financial indicators often reflect improvements in the rest of the economy. But just because the former reflects the latter doesn’t mean that the improvements in financial indicators cause improvements in the rest of the economy; rather, this may be just a correlation.
Thus, we first explain how economists have evaluated the effect of financial conditions and real activity, such as sales and investments.1 The idea, which was used to understand how the level of the financial development of a country affects that country’s output per capita, relies on comparing the performance of economic sectors (e.g., textiles and machinery) with different dependence on external financing.
To answer the second question, this article applies that idea to changes in financial conditions in the U.S. over time. Before presenting our answer to that question, we describe how different sectors depend on external financing for investment, which, as mentioned above, will be the key to identifying how financial conditions affect the rest of the economy.
Last, we present the results, which suggest that changes in financial conditions in the U.S. matter for the level of economic activity, but the effect is moderate.
Financial Conditions
Measuring financial conditions in an economy requires careful examination of different financial indicators, such as bond spreads and equity markets volatility. Financial conditions indexes are the preferred method to summarize the state of financial markets. These indexes collect a variety of financial variables that help characterize the state of financial markets. Similarly, financial stress indexes monitor financial instability by looking at data series that indicate increased likelihood of a crisis. The former tend to encompass a larger universe of financial variables than do the latter. However, since the difference between them is relatively small,2 we will not make any distinction between them and will refer to them both as financial conditions indexes throughout the article.
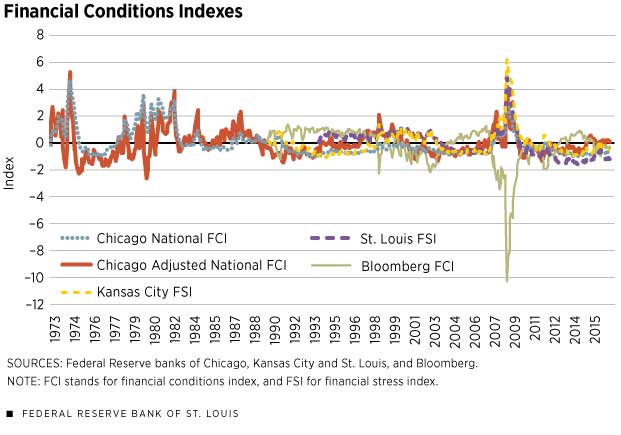
In Figure 1, we have plotted indexes constructed by the Federal Reserve banks of St. Louis, Chicago3 and Kansas City, as well as by Bloomberg. The index from the Chicago Fed has data going back the furthest, 1973, followed by indexes from Bloomberg and the Kansas City Fed, both dating back to 1990, and the index from the St. Louis Fed, which began in 1994. With the exception of Bloomberg’s, a higher value implies tighter financial conditions, while a lower value indicates better financial conditions. The opposite is true for Bloomberg—lower values imply bad (tighter) financial conditions, and higher values imply good (accommodative) financial conditions.
Although the indexes are designed to capture the same concept—the state of financial markets—there are several differences, mostly because the indexes consider different financial indicators. For instance, Chicago’s breaks down the financial conditions into three subcategories—risk, credit and leverage—and collects the financial instruments that help explain these categories, while Bloomberg’s decomposes the financial conditions into U.S. money spread, U.S. bond market and U.S. equity market. Despite the differences, the indexes are highly correlated with one another.4 In what follows, we used Bloomberg’s index to discuss the financial conditions because the data frequency is the highest (daily updates) and the data period coincides with the data from Compustat, from which we obtained other variables required to evaluate the effect of financial conditions on nonfinancial companies.
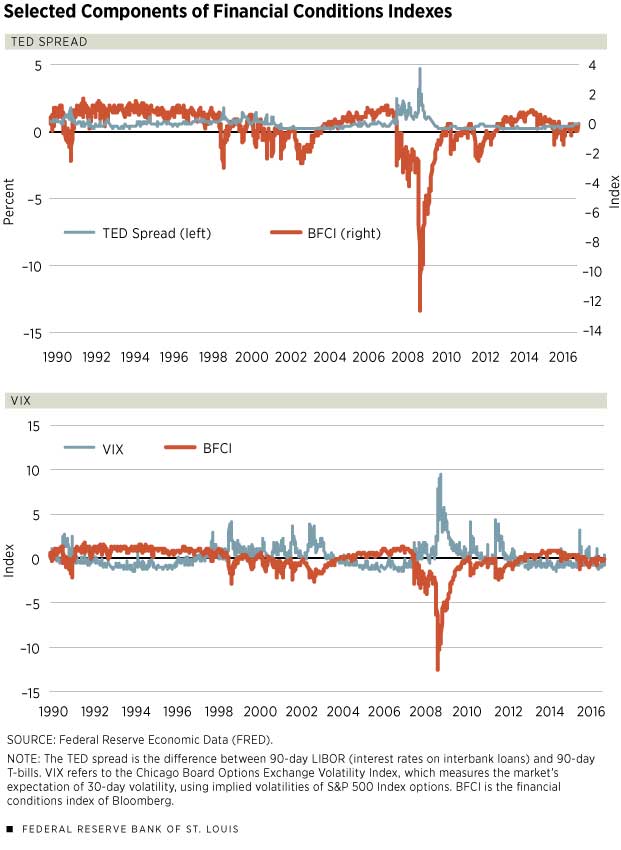
Although there are many subcomponents of these indexes, we chose as examples two financial indicators that are included in the construction of most indexes and plotted them against the Bloomberg index. (See Figure 2.) The TED spread is the difference between the interest rates on interbank loans and on short-term U.S. government debt (Treasury bills, or T-bills). This spread, which is used in all the aforementioned indexes, increases in bad financial conditions. The VIX, the volatility index of the Chicago Board Options Exchange, is also widely used in these indexes; it measures the implied volatility of S&P 500 index options, representing one measure of the market’s expectation of stock market volatility over the next month. Other variables usually included are the commercial paper/T-bill spread and the spread between corporate Baa bonds and 10-year Treasuries, which are included in all of these indexes except Kansas City’s.
How do these indexes help us study the effect of financial conditions on economic activity? The indexes identify periods of good and bad financial conditions; we then look at the performance of companies in terms of sales and investments during those good and bad periods. Table 1 lists the top five quarters for best financial conditions and worst financial conditions from 1990 to 2015 according to one of the indexes, Bloomberg’s index. (We started our analysis at 1990 because of availability of Compustat data.) The early 1990s had the best financial conditions, while the 2007-09 financial crisis was by far the period of the worst financial conditions in recent history.
From Financial Conditions to Real Activity
As mentioned above, one of the main problems in trying to capture the effect of financial conditions on real activity (investments, sales, etc.) is reverse causality. In particular, when firms’ investments and sales are high, financial variables, such as the S&P 500, may look good just as a reflection of economic activity. Thus, an observer will detect a positive correlation between financial conditions and real activity and may infer that financial conditions cause better real activity. In that case, however, better financial conditions would be due to the effect of real activity on financial conditions, and not the opposite.
Exactly the same problem was faced by economists when they studied the effect of financial development for economic development across countries. Are rich countries richer because they have a better financial system? Or is the better financial system a consequence of the countries’ development?
Looking at cross-country data, economists Raghuram Rajan and Luigi Zingales had the idea that if the level of financial development of a country really affects economic activity in that country, it has to be that growth in the country with better financial conditions should be particularly high in the industries that rely more on external financing for investment. In the rest of this article, we apply that idea, but instead of comparing different countries, we compare the U.S. economy in times of good and bad financial conditions. If financial conditions really cause fluctuations in real activity, we should see that when financial conditions deteriorate, the most affected companies are those in the most financially dependent sectors.
Financial Dependence
Are all industries/sectors affected by financial conditions in an equal magnitude? Undoubtedly, all firms may encounter some degree of financial stress during financial bad times, especially during times like the 2007-09 recession. However, some industries suffer more because they depend more on external financing for investment than do other industries. We computed an indicator of financial dependence, Rajan and Zingales’ methodology, for companies in Compustat and aggregated that information at the level of the sector. The indicator is the ratio of capital expenditures minus cash flow from operations to capital expenditures. It reveals the desired investment that cannot be financed through internal cash flow generated by the median company in the sector.5 Thus, sectors with a higher ratio of external financing for their investments are more dependent on the financial conditions of the economy.
In particular, we constructed the Rajan-Zingales index by first calculating the index for individual companies for all years from 1990 to 2015 in Compustat. We then computed the median value of the Rajan-Zingales index across all companies within the same sector to find each sector’s dependency on external financing. We used the median value to represent the financial dependence of the sector because there are some firms with extreme values in the index; these outliers would have distorted the data if we had used the mean value. For an analogous purpose, we used the median value of the index across all years. Thus, we ended up with one value of the Rajan-Zingales index for each sector in Compustat.
Table 2 lists the sectors with the highest and the lowest dependence on external financing. Apparel and tobacco emerge as the industries with the lowest dependence on external finance, while drugs and machinery top the list of those with the highest financial dependence. These rankings should be of no surprise because the apparel and tobacco industries have high cash flow, reducing the need for external finance; at the other extreme, the drug, or pharmaceutical, industry has high negative cash flow from operations, with a large need to use external financing to achieve desired investment. Machines and research follow very closely behind drugs in their financial dependence. These results resemble the findings by Rajan and Zingales.
Real Economic Activity
Now that we have discussed measures of financial conditions and measures of dependence on external financing, we only need measures of real activity to be able to evaluate whether sectors that are more dependent on external financing perform worse in bad financial conditions than the other sectors, and vice versa. We have recorded the growth in sales and investment for each sector, and we have classified sectors into low and high financially dependent industries (bottom 50 percent and top 50 percent). Table 3 summarizes our analysis of the growth throughout the sample period of 1990-2015, during good financial times and during bad financial times, defined by the periods with the 10 percent highest and lowest of the Bloomberg financial conditions index.
Here we observe that, over the entire time period (good and bad), growth of sales for sectors that have low dependency on external financing is 8.10 percent, while growth of investment for these sectors is 5.85 percent. Similar numbers are obtained for the entire time period for the sectors that have a high dependency on external financing: Sales growth is 8.96 percent, and investment growth is 5.62 percent.
However, when we look at good financial times, we see a clear difference in the growth of both variables among the two categories of sectors. The growth of sales during good financial times is 12.81 percent for companies in sectors with low dependence on external financing and 14.17 percent for companies in sectors with high dependence. Similarly, investment growth during good financial conditions is 18.90 percent for companies in sectors with low dependence and 20.64 percent for companies in sectors with high dependence.
Similarly, when we look at bad financial times, we see a significant decrease in the growth of all companies, but sectors with high dependence on outside financing fared worse during the bad financial times. In particular, the growth of sales decreased from 2.16 percent to 1.42 percent, and the growth of investment decreased from –10.86 percent to –14.89 percent. We can also see that the growth of investment reacts with more volatility to the change in financial conditions than the growth of sales does, as would be expected.
Overall, the results in Table 3 show that the sales and investments of companies in more financially dependent sectors react more to the financial conditions indexes than of companies in less financially dependent sectors. These results confirm that there is, indeed, an effect from financial conditions to real activity. The size of the effect, however, is moderate. The difference in the growth of investment between good and bad financial times is about 30 percentage points (18.9%- (–10.9%)) for companies in the least financially dependent sectors and of 35 percentage points (20.6%- (–14.9%)) in the most financially dependent sectors. Therefore, the difference for investment between sectors with different financial dependence across the best and worst financial conditions is only about 5 percentage points. For sales, the difference is about 2 percentage points.
Conclusion
This article shows that financial conditions, measured by financial conditions indexes, affect real activity, but the effect is moderate. In particular, we show that industries that depend more heavily on external financing for investment are affected more, in terms of investment and sales, by bad financial conditions than are industries that rely less on external financing. Given data limitations, our findings correspond only to publicly traded firms, with better access to financial markets. One may expect that smaller firms, with less access to credit, may be even more affected by financial conditions. However, recent work by economists Marianna Kudlyak and Juan Sánchez suggests that during the 2008 financial crisis large firms were affected more than small firms.
Juan M. Sánchez is an economist, and Hee Sung Kim is a research associate, both at the Federal Reserve Bank of St. Louis. For more on Sánchez’s work, see https://research.stlouisfed.org/econ/sanchez.
Endnotes
- Throughout the article, real economic activity will be measured using information on sales and investment of publicly traded companies. [back to text]
- See Kliesen et al. [back to text]
- The Federal Reserve Bank of Chicago has two indexes: national and adjusted national. The adjusted one isolates a component of financial conditions uncorrelated with economic conditions to provide an update on financial conditions relative to current economic conditions, since U.S. economic and financial conditions tend to be highly correlated. [back to text]
- See Hatzius et al. for a detailed comparison of different indexes. [back to text]
- See Rajan and Zingales. [back to text]
References
Hatzius, Jan; Hooper, Peter; Mishkin, Frederic; Schoenholtz, Kermit; and Watson, Mark. “Financial Conditions Indexes: A Fresh Look after the Financial Crisis.” Working Paper No. w16150. National Bureau of Economic Research (NBER), 2010.
Kliesen, Kevin; Owyang, Michael; and Vermann, Katarina. “Disentangling Diverse Measures: A Survey of Financial Stress Indexes.” Federal Reserve Bank of St. Louis’ Review, 2012, Vol. 94, No. 5, pp. 369-97.
Kudlyak, Marianna; and Sánchez, Juan M. “Revisiting the Behavior of Small and Large Firms during the 2008 Financial Crisis.” Journal of Economic Dynamics and Control, forthcoming.
Rajan, Raghuram; and Zingales, Luigi. “Financial Dependence and Growth.” American Economic Review, 1998, Vol. 88, No. 3, pp. 559-86.


Views expressed in Regional Economist are not necessarily those of the St. Louis Fed or Federal Reserve System.
For the latest insights from our economists and other St. Louis Fed experts, visit On the Economy and subscribe.
Email Us