


Disability Rate Exceeds Nation's; Problem Is Worse in Rural Areas
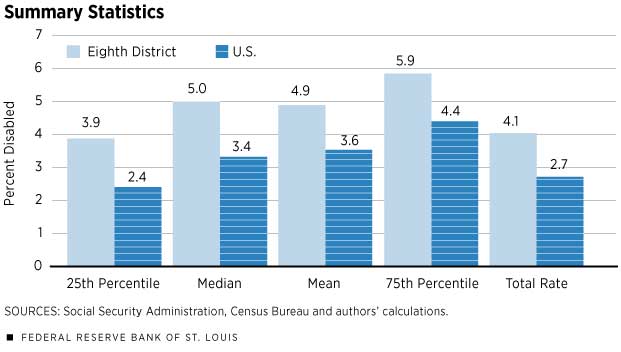
The Eighth District has a much higher share of Social Security Disability Insurance (SSDI) recipients than the rest of the country: Inside the District, 4.1 percent of the population are SSDI recipients, but in the rest of the country, 2.6 percent receive SSDI.1 Large differences in disability rates are not unusual across geographies, however. Outside the District, the interquartile range—a measure of the spread between the counties with the lowest rates of disability and the highest rates of disability—is 1.8 percentage points. Even within the District, the interquartile range across counties is 2.0 percentage points. Figure 1 shows summary statistics for disability rates across counties in the U.S. and in the Eighth District. It has two messages: Disability is quite dispersed, and rates are uniformly high in the District.
The Role of Job Availability
Why should there be so much variation in disability rates across geographic regions? Although we all face health risks that might prevent us from working, it is well-established that health outcomes differ across regions. Geographic differences in behavior, genetics and health care may all contribute to this variation. However, SSDI not only tracks health outcomes across geographic regions, it responds to differences in economic conditions across geographic regions. In a region with ample job opportunities, workers who suffer physical disabilities are more likely to be able to find work that is suitable for their skills and capabilities; however, in a region with relatively sparse jobs and where many of the jobs have fundamental manual requirements, it will be difficult for disabled people to find work. Of course, these economic differences will affect the likelihood that a worker applies for SSDI. The Social Security Administration (SSA) explicitly considers these economic factors when granting benefits.
The SSA awards process introduces criteria sequentially, considering new factors at each stage. Initially, disability is decided purely on the applicant’s health condition. For marginal cases, for which there is a clear health problem but not one that obviously prevents all work of any kind, the SSA will examine “vocational considerations”—the worker’s other job prospects. Increasingly, these marginal cases are becoming the norm.
Vocational considerations cases have been an important factor in the rise in disability over time. SSDI rolls have increased steadily since 1984, tripling as a fraction of the population, even as the eligibility criteria have remained mostly unchanged. As we point out in our 2016 study, vocational considerations have risen from about one-fourth of awards to about three-fifths.2 These economic criteria have a prominent role in the SSDI awards process; so, we could reasonably expect that disability rates would follow the great disparities in job opportunities across counties. Time and again, we are reminded that regions have diverged economically—so too have SSDI rates, in part because its awards process responds to the economic conditions its applicants face.
Within the Eighth District, there are large differences in disability rates, as we saw in Figure 1. These differences are especially stark, however, when we compare rural and nonrural counties, the latter being metropolitan statistical areas (MSAs). The differences are summarized in the table. Disability rates are much lower in counties within the District’s MSAs than in rural counties. The median disability rate among MSA counties in the Eighth District is 1.2 percentage points lower than the median among rural counties. Rural counties also have a wider range of disability rates than MSA counties: The difference between the rural counties with relatively high disability rates (those in the 75th percentile) and those with low disability rates (those in the 25th percentile) is 1.7 percentage points, compared with 1.5 percentage points for MSA counties. However, among both rural and nonrural counties, the spread around the mean is roughly symmetric, which we can see from the fact that the mean and median are approximately equal in both groups.
Additionally, there are numerous sparsely populated counties with high disability rates. These counties account for the difference between the average disability rate as seen in the table for the counties, 4.9 percent, and the total disability rate in the District as seen in the bar chart, 4.1 percent. The former is a simple average of the county disability rates, while the total disability rate is the total number of people on disability rolls in the District divided by the total population of the District.
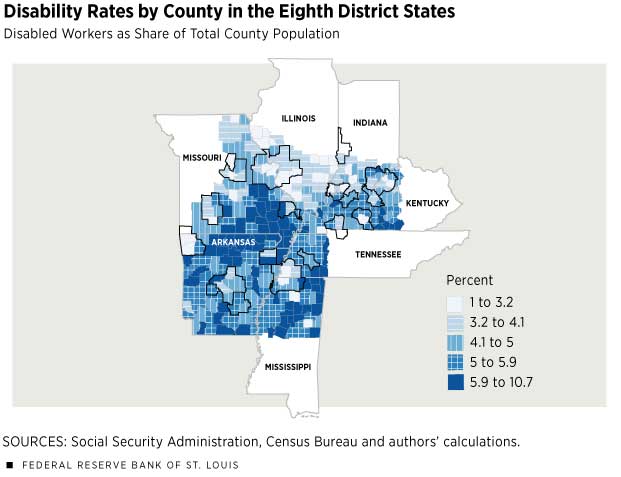
Figure 2 shows clear patterns as to where the incidence of disability is concentrated. The Ozarks region spanning north-central Arkansas and southeastern Missouri has a high concentration of counties with uniformly high rates of disability. Elsewhere in the District, north-central Mississippi has another high concentration of high disability. These rural areas are historically very poor, and employment opportunities have always been scant. In these regions, a worker whose health prevents physically demanding work will find it difficult to obtain other employment opportunities. The result, as we see, is a high incidence of disability.
Conclusion
The data are informative about the state of the labor market in the Eighth District relative to the rest of the country. By some measures, the District looks quite similar to the nation. For instance, the unemployment rate in the District has been within a few percentage points of the national rate for several months. But unlike business cycle indicators such as the unemployment rate, SSDI is slow to adjust and reflects a long-term trend. Whereas indicators like median wage growth tell us how the average worker is doing, SSDI tells us more about how the least prosperous worker is doing. Those who receive disability insurance very rarely work again, but benefits—which average about $1,200 per month—are scarcely as much income as even unskilled workers can make.
David Wiczer is an economist, and James Eubanks is a senior research associate, both at the Federal Reserve Bank of St. Louis. For more on Wiczer’s work, see https://research.stlouisfed.org/econ/wiczer.
Endnotes
- This article considers recipient workers of SSDI, rather than survivors and dependents who also may claim benefits. This prevents variation in household size across geographies from affecting our conclusions. [back to text]
- See Michaud, Nelson and Wiczer. [back to text]
Reference
Michaud, Amanda; Nelson, Jaeger; and Wiczer, David. “Vocational Considerations and Trends in Social Security Disability.” Federal Reserve Bank of St. Louis working paper series, 2016, No. 2016-018A.

Views expressed in Regional Economist are not necessarily those of the St. Louis Fed or Federal Reserve System.
For the latest insights from our economists and other St. Louis Fed experts, visit On the Economy and subscribe.
Email Us