COVID-19 and States’ Revenues: An Analysis
KEY TAKEAWAYS
- Although 2020’s pandemic-related recession was deep, state tax revenue losses were not as severe as in past recessions.
- During the fourth quarter of 2020, a federal stimulus-related rebound in household spending helped mitigate state revenue losses.
- Projections for state tax revenues in 2021 are optimistic, although overall recovery slowed at the end of 2020, and uncertainty remains.

During the 2001 and 2007-09 recessions, state governments faced tax-related revenue shortfalls caused largely by job and income losses, even after other sectors of the economy began to recover. And, although the 2020 recession was likely the deepest in recorded history—with early 2020 projections indicating that state budgets could face record revenue shortfallsIn aggregate across all states, sales tax contributes 31% of states’ revenues, with a range of 0% to 61%, meaning some states have no sales tax revenue and some have much higher state sales tax revenues. Income tax contributes 38%, with a range of 0% to 74%.—there is reason for optimism.
An abrupt rebound in household spending in the fourth quarter, in part from the federal aid to households and businesses, has helped mitigate such revenue losses so far. In fact, nearly half of states reported increases in revenue through the fourth quarter of 2020.Twenty-three of 51 states (including Washington, D.C.) reported at least a slight increase in tax collections in 2020 over 2019, according to census data.
This indicates revenues could recover much faster than in previous recessions because many pandemic-related layoffs are considered temporary and the amount of fiscal aid substantial. However, prior recessions indicate the importance of public sector recovery, as employment in the public sector in March 2018 was still 0.5% lower than in March 2008, which was associated with years of constrained essential government services.
A Closer Look at State Revenues
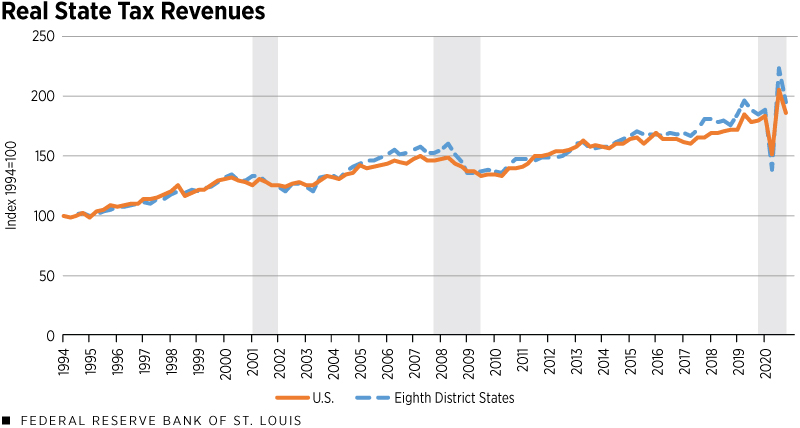
The first figure below shows that after the 2001 and 2007-09 recessions, state revenues (inflation adjusted) remained stagnant for multiple quarters before reaching pre-recession levels. Strongly diverging from this trend, revenues in the COVID-19-induced recession initially followed a V-shape pattern—falling and then rising sharply—before returning to a slower growth in the fourth quarter. However, some of the V-shape might be attributed to postponed activity and stay-at-home orders.

SOURCES: Census Bureau and authors' calculations.
NOTES: The figure plots seasonally adjusted, real tax revenue indexed so the average quarter in 1994 is equal to 100. Shaded areas indicate recessions.
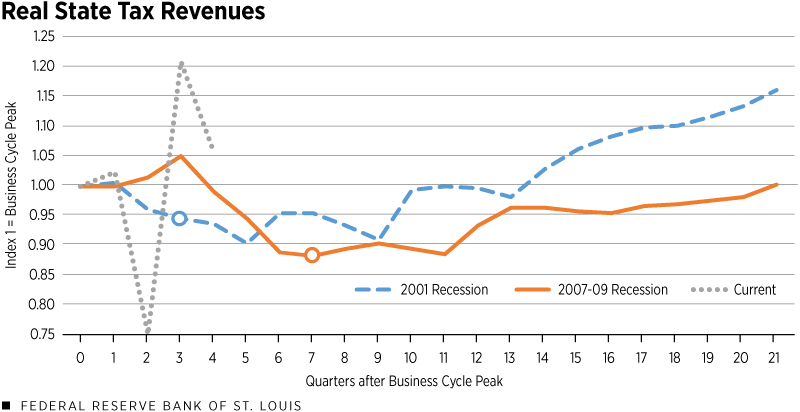
The second figure below examines more closely the trends shown in the first figure by indexing state revenues during each recession to a value of 1 in the quarter prior to the recession. The data points (circles) highlighted denote the end of each recession.
It is easier to see how states’ revenues remained suppressed, even after recessions ended. Despite the recessions’ ending after three quarters in 2001 and seven quarters in 2009, the recovery in states’ revenues took around 10 and 20 quarters, respectively. This is in stark contrast to the one-quarter rebound experienced in 2020.

SOURCES: Census Bureau and authors’ calculations.
NOTES: The figure shows real state revenues, measured by tax collections, over the course of the three previous recessions, with Period 0 being the quarter immediately preceding the recession and Index 1 being equal to the state revenue at Period 0. Points indicate end of recession.
The quick rebound of the gray line indicates that collections in the fourth quarter were about 6% higher than their pre-COVID-19 levels. When combined with the losses during the second quarter and gains during the third, aggregate revenues during the recession were down only 1.8%.
Looking at specific revenue sources from fourth quarter 2019 to fourth quarter 2020, sales tax collections increased slightly, by just under 4%. Meanwhile, tax collections from personal and corporate incomes increased by 10% and 32%, respectively. The 10% growth in personal income taxes alone accounts for about 51% of the aggregate growth in states’ collections compared with pre-pandemic levels.
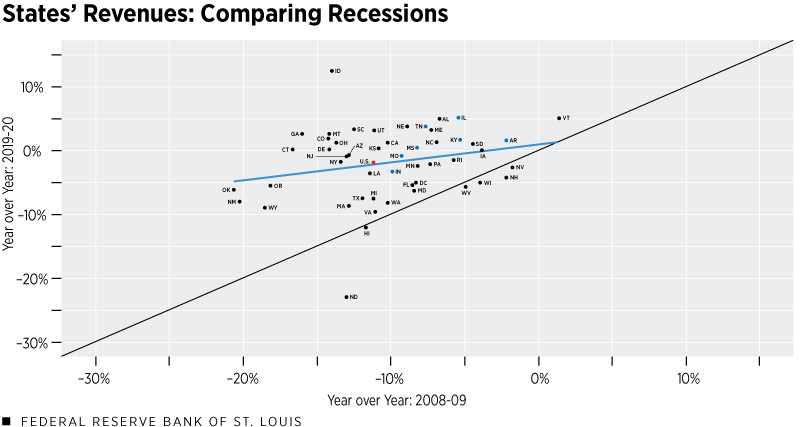
While national averages are useful for conveying the trends, there are considerable differences across states. The third figure below plots the current year-over-year decline in revenues from 2019 to 2020 on the vertical axis, and a year-over-year decline from 2008 to 2009 on the horizontal axis.

SOURCES: Census Bureau and authors’ calculations.
NOTES: The figure shows the year-over-year percent change in state tax revenues for the 2008-09 recession on the x-axis and the year-over-year for 2019-2020 on the y-axis. Alaska values (-67.3%, -33.6%) consistent with the positive trend (the blue line) were excluded from the figure to improve readability.
The states in the Federal Reserve’s Eighth District are highlighted in blue. The black, 45-degree line allows for easer comparison between these recessions: States above the black line had stronger revenue growth (or weaker declines) than in 2009. Most states experienced less severe revenue declines during the COVID-19 recession, as the data points are clustered around zero but above the black line.
The figure highlights a few themes: First, average state revenues, denoted by the red point, have declined slightly, contracting by 1.8% in 2020—less severely than in 2009, when revenues declined more than 11%. Second, All Eighth District states except Indiana, denoted by the blue dots, have performed better than the national average and above the trend line during both recessions. Third, Arkansas, Illinois, Kentucky, Mississippi and Tennessee experienced net increases in revenues relative to the prior year. This is in sharp contrast to 2009, when even the most stable District state, Arkansas, still experienced a 2.2% loss in tax revenue, and only Vermont reported positive revenues that year.
The blue linear trend line indicates a slight positive correlation between how states fared over the two recessions. States that experienced steep revenue declines in 2009 are more likely to have experienced steep declines during the current recession. This suggests structural effects of state revenues may be important, or some states are more sensitive to the overall business cycle because of factors such as industry mix.
Our initial analysis does not indicate a strong, distinct causal relationship between the decline in states’ revenues and factors that may be related to the pandemic, such as share of economy in the leisure and hospitality sector (which have been hit hardest by social distancing and stay-at-home orders) or share of states’ collections derived from sales taxes.A more in-depth regression analysis could be possible to make a clearer determination. However, the scope is larger than the purposes of this article.
The Path Forward
The notion of a fiscal recovery is incredibly important for the long-term health of states’ budgets and the overall economy. In early 2020, it was expected that the pace of economic recovery was directly tied to the path of the pandemic. Forecasters at that time expected a prolonged economic contraction or, at best, an anemic recovery, with the unemployment rate remaining at historic levels beyond 2020.
This economic outlook had dire implications for state revenues, with projected losses for fiscal year 2021 between 9% and 28% of own-revenue with additional surges in COVID-19 cases. However, the path of the economy and path of the virus, while still related, ended up with a weaker correlation than initially thought.
While an additional surge in cases occurred in late 2020, real gross domestic product (GDP) grew at an annualized rate of 4.3% in the fourth quarter. Although lower than expectations, this was a far cry from the disastrous effects of a second COVID-19 wave that were predicted.
There is a case for cautious optimism in terms of economic recovery. The Federal Reserve Bank of Philadelphia’s First Quarter Survey of Professional Forecasters raised its annual GDP growth projection from 4% to 4.5% for 2021.
For comparison, this same survey predicted real GDP growth of -2% for 2009, which proved fairly accurate, as the economy contracted by -2.5% that year.
The current optimism could bode well for states’ revenues. Forecasters at IHS Markit predict states’ tax receipts will resume normal growth in 2021 without the prolonged decline seen in 2001 and 2009. Why the quick rebound? The short answer: Households are financially better off this time, and disposable incomes are almost 13% higher than one year ago as of January 2021. Household attitudes are also surprisingly positive as well; the share of the population that considered itself worse off than a year ago in the fourth quarter of 2020 was 28%, whereas in the fourth quarter 2008, it was 59%. This contributes to the large increases in income and corporate tax collections, as well as other consumption-based revenue streams.
A Position of Strength
This relative stability in incomes could indicate why state revenues were able to recover quickly in 2020. A September 2020 report by the Brookings Institution estimated that total aggregate federal aid to states of $250 billion will exceed their projected state and local revenue loss of $188 billion.
However, the report cautions that this does not mean the aid is sufficient. In general, Federal aid can improve states’ revenues in a number of ways. For example, it can include direct relief to cover budget shortfalls and depleted reserves.The Coronavirus Aid, Relief, and Economic Security (CARES) Act included $150 billion in such aid. Aid can also indirectly benefit states by increasing incomes and consumer spending and, thus, tax revenues.
But due to the drastic revenue shortfalls initially, as well as the increased demand for states’ spending on pandemic-related issues—public health, hospital funding, virtual schooling, vaccine rollout and others—simply providing enough aid to return to pre-pandemic levels of spending may not be sufficient to cover full budget shortfalls.
This is an important point, as fiscal aid is likely necessary for a swift recovery. Almost all states have some measures requiring a balanced budget, which makes deficit spending—the federal government’s tool for promoting economic recoveries—impossible. This means states will have to look to balance their budgets through tax increases, workforce reduction or cuts to needed services—all of which may prolong recovery. Indeed, state and local governments have cut their workforces by 5% during the pandemic, and some of the states that performed best in regard to revenue enacted tax increases during 2020.
In general, state governments entered 2020 in relatively strong positions.This included $119 billion in rainy day funds and general budget surpluses, according to the Brookings article. While an overall recovery slowed at the end of 2020, projections remain optimistic, and states’ revenues are already in a stronger position than during the previous recession, despite the latest recession being deeper. All things considered, the general optimism of a quick recovery in states’ revenues may be warranted, but uncertainty remains.
On Feb. 10, Federal Reserve Chair Jerome Powell gave a speech in which he emphasized that, while the overall outlook may be strong, aggregate job losses remain higher than in the 2007-09 recession. The harmful effects have affected households and communities differently, most severely impacting those with the lowest incomes. Consequently, these households may require additional government support to recover fully in the long run.
Endnotes
- In aggregate across all states, sales tax contributes 31% of states’ revenues, with a range of 0% to 61%, meaning some states have no sales tax revenue and some have much higher state sales tax revenues. Income tax contributes 38%, with a range of 0% to 74%.
- Twenty-three of 51 states (including Washington, D.C.) reported at least a slight increase in tax collections in 2020 over 2019, according to census data.
- A more in-depth regression analysis could be possible to make a clearer determination. However, the scope is larger than the purposes of this article.
- The Coronavirus Aid, Relief, and Economic Security (CARES) Act included $150 billion in such aid.
- This included $119 billion in rainy day funds and general budget surpluses, according to the Brookings article.
Views expressed in Regional Economist are not necessarily those of the St. Louis Fed or Federal Reserve System.
For the latest insights from our economists and other St. Louis Fed experts, visit On the Economy and subscribe.
Email Us


