


Headwinds, Tailwinds and Whirlwinds: Forecasting the 2019 Economy
KEY TAKEAWAYS
- Conflicting data and the partial government shutdown made economic forecasting more challenging at the end of 2018 and the start of 2019.
- Lower oil prices have helped throttle back inflationary pressures in the second half of 2018.
- Though some are worried about a recession, many forecasters expect the U.S. economy to post solid growth in 2019.
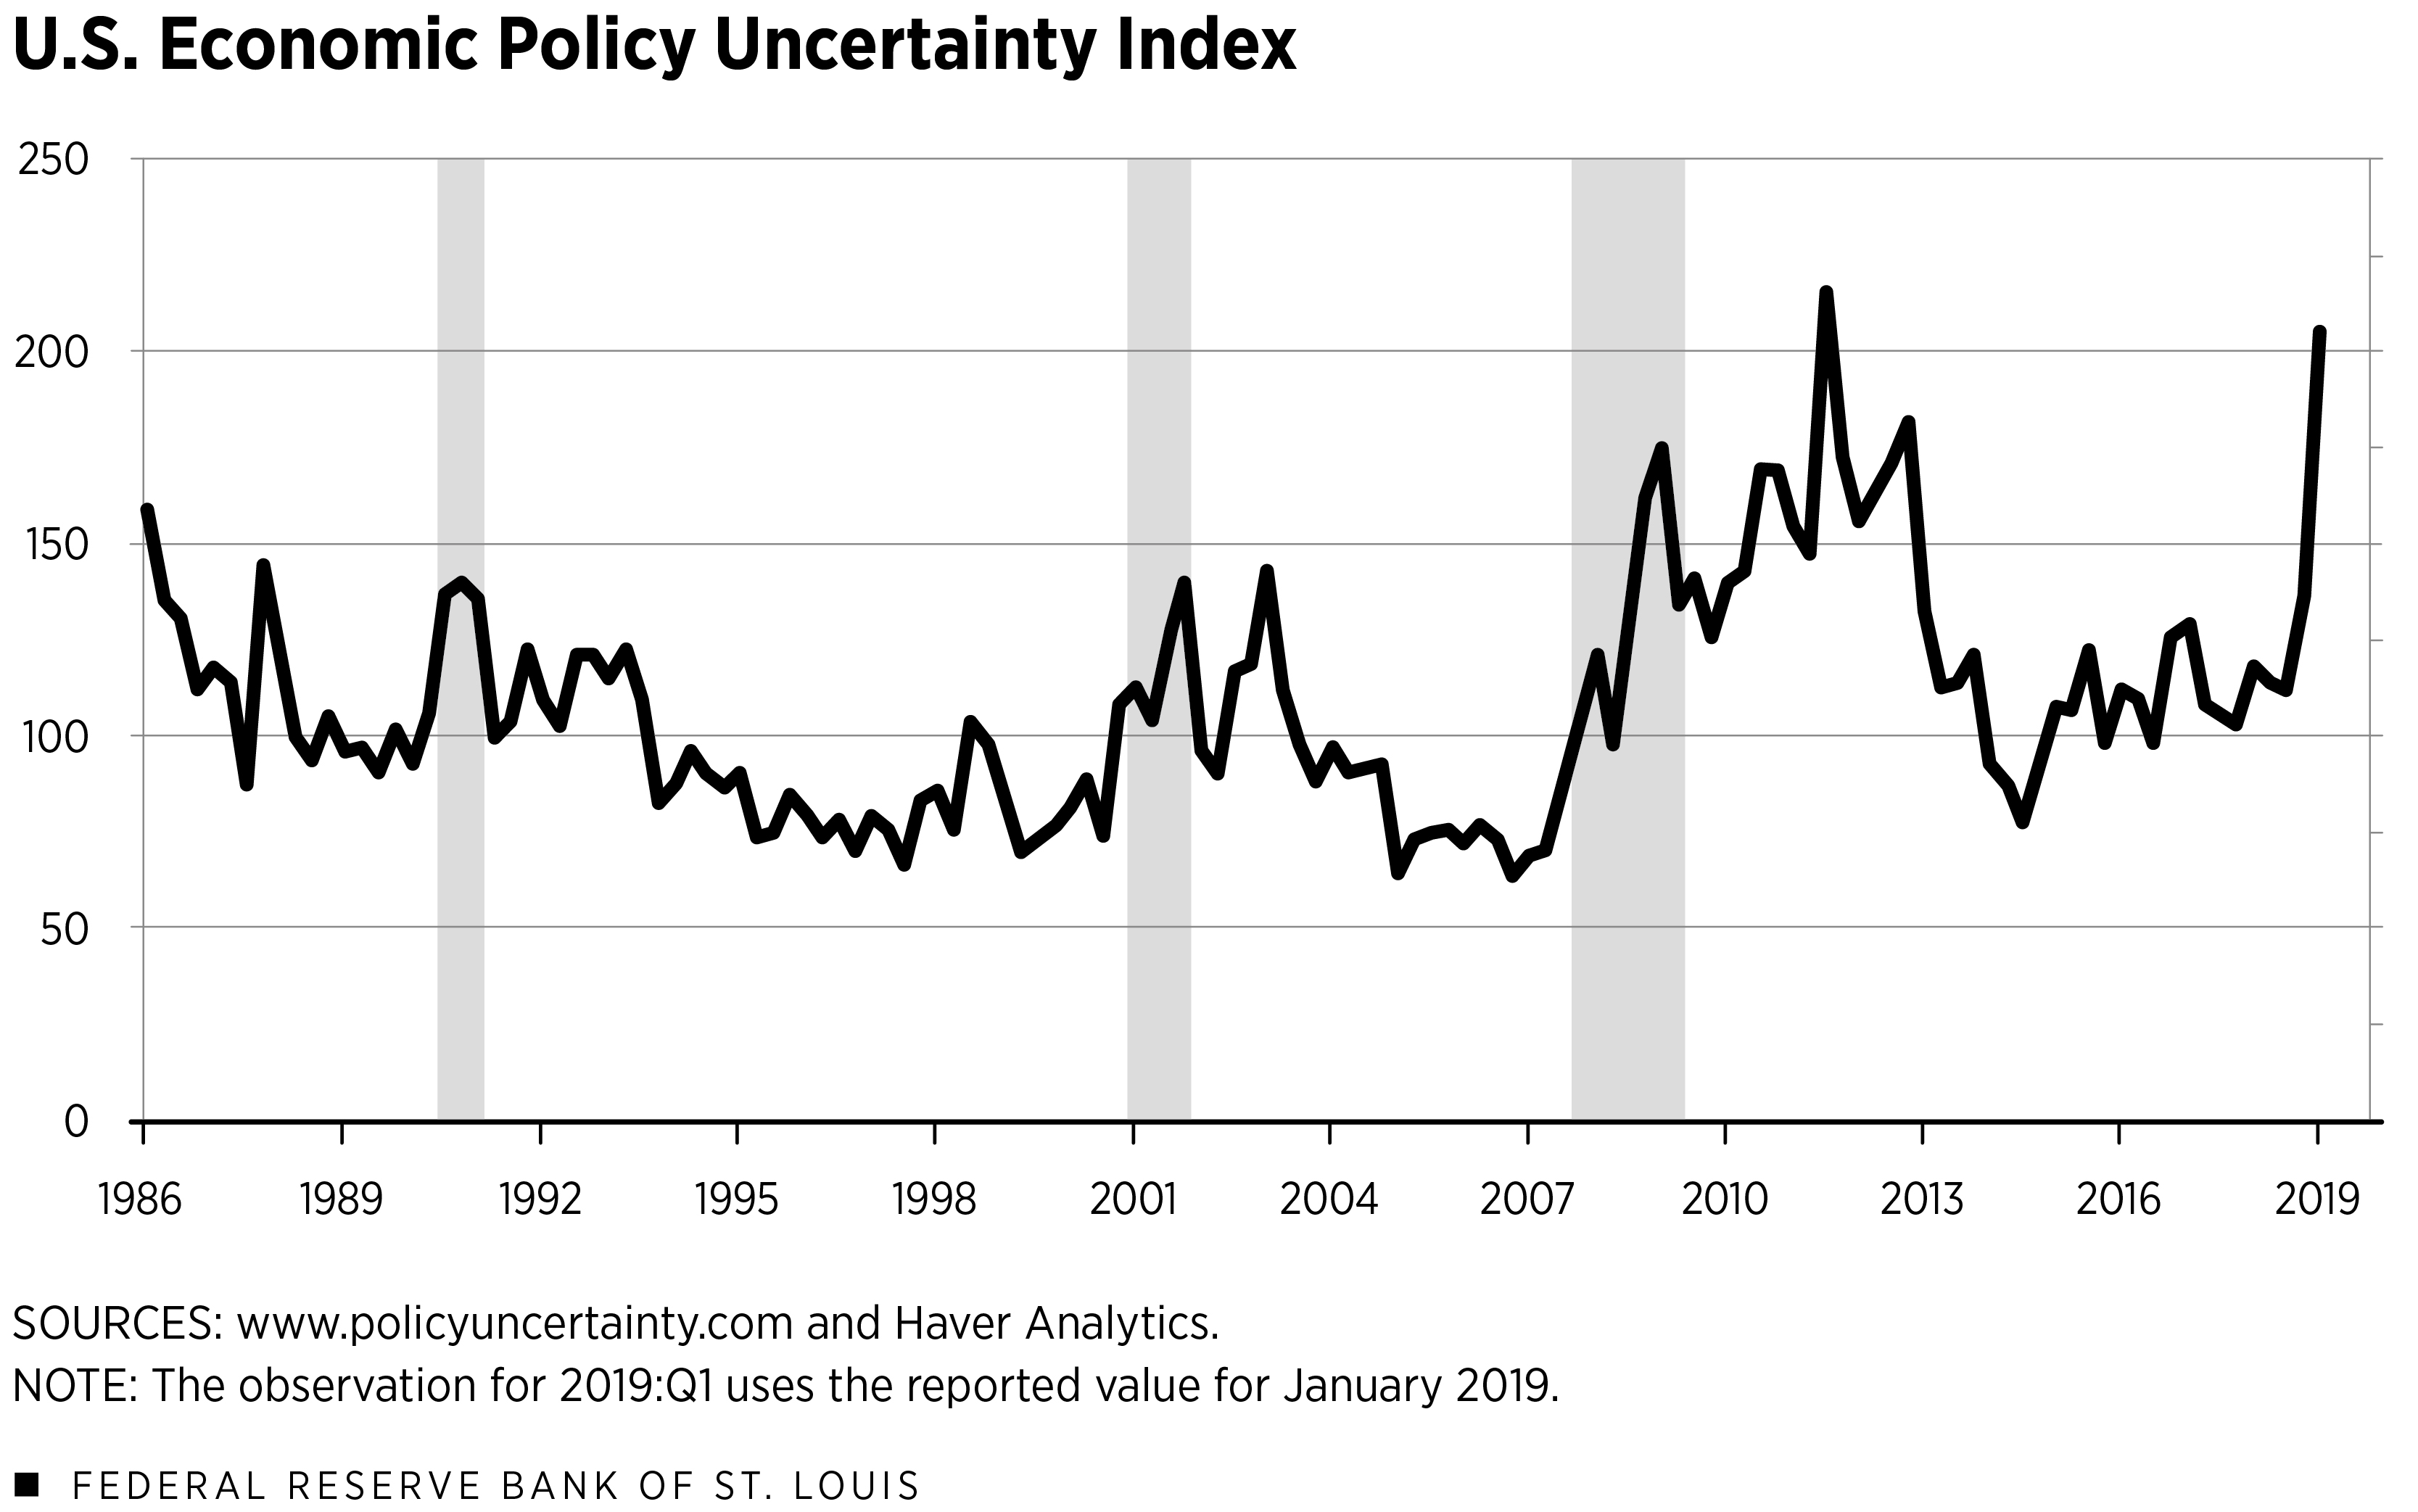
As noted in our article in the previous Regional Economist, the U.S. economy appeared to be growing at a solid pace over the final three months of 2018. However, uncertainty about the near-term outlook was rising because of emerging weakness in housing and business investment. Measures of uncertainty rose sharply at the end of 2018 and into early 2019 (see figure below), as a 35-day partial government shutdown—exacerbated by rising trade tensions between the U.S. and China—triggered a modest erosion in consumer confidence and rising levels of financial market distress.
Facing further signs of an emerging global slowdown but comforted by falling oil prices that exerted downward pressure on inflation and interest rates, the Federal Open Market Committee (FOMC) signaled at the conclusion of its Jan. 29-30 meeting that monetary policy was likely to remain in a holding pattern for a while.
All Mixed Up
The partial government shutdown that lasted from late December 2018 to late January 2019 delayed the release of several key economic reports, including the Bureau of Economic Analysis’ fourth-quarter advance estimate for real gross domestic product (GDP) and Census Bureau reports on new-home sales, new construction, and orders and shipments for durable goods. But other government agencies and data-reporting entities were up and running, including the Department of Labor and the Federal Reserve Board. Analyzing the state of the economy at the end of 2018 and into early 2019 was especially challenging.
As the reports on economic activity in November and December began to trickle in, coupled with the regularly scheduled reports on activity in January and early February, it became clear that the economy’s momentum had slowed. In view of past unexpected first-quarter slowdowns, this is perhaps unsurprising.To read more about the issue of residual seasonality, see Owyang and Shell. Still, the data were mixed. For example, retail sales in December were shockingly—and puzzlingly—weak, despite strong job growth, accelerating wage growth and few indications from retailers that the holiday sales season was nothing short of solid. Then, key data in January portrayed a similar mixture of robust economic conditions (another gangbuster employment report) and very weak conditions (a sharp decline in industrial production). This pattern played out with other key January data: continued low initial claims for state unemployment benefits but a noticeable dip in light-vehicle sales.
Despite some data contradictions, Fed policymakers took comfort that inflation pressures were throttling back. As measured by the consumer price index, headline inflation (all items) slowed over the second half of 2018 and into January 2019. After reaching a peak of 2.9 percent in July 2018, inflation slowed to a 1.5 percent rate in January 2019 (measured in 12-month percentage changes). A weaker inflation trajectory largely reflected the plunge in crude oil prices over this period from a little less than $71 per barrel to about $51.50 per barrel. Lower oil prices translated into falling prices for refined products like gasoline and diesel, helping to bolster the purchasing power of consumers.
Falling inflation rates have also helped to lower market-based measures of inflation expectations, thereby putting downward pressure on long-term nominal interest rates. Lower interest rates, in turn, have spurred a modest uptick in mortgage applications.
Despite the fog of contradictory data, financial market conditions have improved markedly since the first of the year. Through mid-February, the Wilshire 5000 stock (equities) price index is up by nearly 13 percent, and the St. Louis Fed’s Financial Stress Index has fallen sharply after rising to a roughly two-year high at the end of 2018.
The FOMC Says It Will Be Patient
Some of the rebound in financial sentiment was undoubtedly due to a shift in the stance of monetary policy. At the conclusion of its December 2018 meeting, FOMC policymakers agreed to raise the target range for the federal funds rate by 25 basis points to 2.25 to 2.5 percent, the fourth such increase in 2018. In the Summary of Economic Projections (SEP) released after the December meeting, 11 of the 17 FOMC participants expected at least two more 25 basis point rate hikes by the end of 2019. But with financial distress on the rise in late December and early January, and inflation pressures easing, several Federal Reserve officials—including Chairman Jerome Powell—signaled that they had the luxury of waiting to see how the economy would evolve in 2019. Indeed, in the Jan. 30, 2019, FOMC statement, the committee said that it would be “patient as it determines what future adjustments” may be appropriate.
Although the whirlwinds buffeting the economy have caused some to warn of an impending recession—or, at a minimum, much weaker growth—the domestic economy continues to expand. Indeed, the consensus of the FOMC and professional forecasters is that the U.S. economy will continue to register solid GDP growth and low inflation in 2019. In December’s SEP, the median GDP growth estimate among FOMC participants was 2.3 percent. If that GDP forecast bears out, then the current U.S. business expansion will become the longest on record on July 1, 2019.
Kathryn Bokun, a research associate at the Federal Reserve Bank of St. Louis, provided research assistance.

Views expressed in Regional Economist are not necessarily those of the St. Louis Fed or Federal Reserve System.
For the latest insights from our economists and other St. Louis Fed experts, visit On the Economy and subscribe.
Email Us