U.S. Economy Continues to Strengthen
KEY TAKEAWAYS
- U.S. GDP growth accelerated to 2.5 percent last year from 1.8 percent in 2016, exceeding forecasters’ expectations.
- Modest reductions in income tax rates and increases in federal government spending are expected to help strengthen the economy in 2018.
- Long-term inflation expectations have moved steadily higher so far this year.

From an economic standpoint, 2017 was a good year. Compared with 2016, the U.S. economy registered stronger real gross domestic product (GDP) growth, continued low inflation, a further drop in the unemployment rate and record-high equity prices. Indeed, last year’s economic performance exceeded the expectations of most professional forecasters. This performance was all the more impressive since it occurred against the backdrop of a modest tightening in monetary policy—and, moreover, the prospect of further modest tightening actions in 2018.
Most forecasters are anticipating a continued strengthening in economic activity in 2018 because of this year’s modest reductions in personal and corporate income tax rates and increases in federal defense and nondefense government expenditures. A key question is whether inflation will also heat up.
Building Economic Momentum
Compared with 2016, real GDP growth accelerated from 1.8 percent to 2.5 percent in 2017.1 Last year’s acceleration in output growth reflected, to a large extent, much stronger growth in real business fixed investment and exports of goods and services. The acceleration in business capital spending was especially heartening, since it generally signals increased confidence in the economic outlook by businesses. Increased capital spending and exports naturally boosted the nation’s industrial sector. Following a 0.1 percent decline in 2016, industrial production rose by 3.5 percent in 2017; this was the largest increase in seven years. The demand for goods reflected solid real consumption spending in 2017 (2.8 percent); however, real residential fixed investment advanced at a more modest pace (2.6 percent), while total government expenditures accelerated slightly in 2017 (0.7 percent).
In late December 2017, the Tax Cuts and Jobs Act was signed into law. Two key provisions of the act were the reduction of marginal tax rates for most individuals and the lowering of the statutory U.S. corporate tax rate from 35 percent to 21 percent. According to the Joint Committee on Taxation of the U.S. Congress, the act is expected to lower U.S. tax revenues by about $1 trillion over the next 10 years, or about $100 billion a year. While sizable in dollar terms, the revenue loss is quite modest in terms of GDP—0.6 percent.
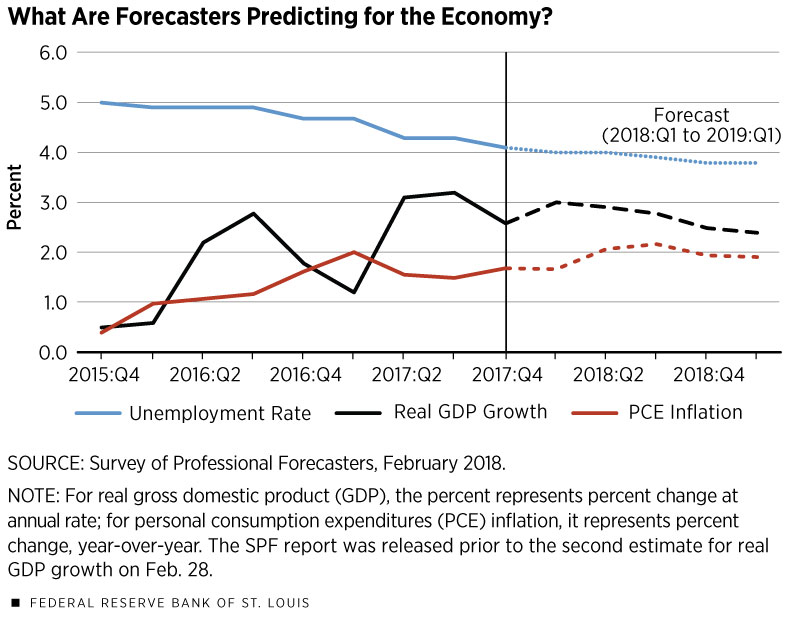
The tax reform package has spurred many forecasters to raise their medium-term outlook for the U.S. economy. For example, the February 2018 Survey of Professional Forecasters (SPF) projects that real GDP will increase by 2.8 percent in 2018; this increase is moderately larger than the forecast from six months earlier (2.4 percent). The SPF projects that real GDP growth will then slow to 2.5 percent in 2019 and then to 2 percent in 2020. The pace of economic activity could get a further boost over the next two years because of the Bipartisan Budget Act that was signed into law in February. The budget act, among other things, increases federal defense and nondefense discretionary expenditures by nearly $300 billion in fiscal years 2018 and 2019, and an additional $90 billion in supplementary spending for natural disaster relief.
Although the unemployment rate is already quite low at 4.1 percent, the SPF projects that, with stronger growth, the unemployment rate will decline to an average of 3.8 percent in the fourth quarter of 2018 and remain at a 3.8 percent average in 2019, but then drift back up to an average of 3.9 percent in 2020.
Inflation Developments
In January 2012, the Federal Open Market Committee (FOMC) established a 2 percent inflation target for the personal consumption expenditures price index (PCEPI). Since then, inflation has regularly been below the FOMC’s target. In 2017, the PCEPI increased by 1.7 percent, which followed gains of 1.6 percent in 2016 and 0.4 percent in 2015. But with the pace of economic activity heating up and the unemployment rate expected to fall slightly further in 2018, the SPF projects that inflation will firm to 1.9 percent in 2018 and to 2 percent in 2020.
It is important to remember, though, that the relationship between the unemployment rate and inflation—known as the Phillips curve—is extremely weak or nonexistent. As a result, it is generally thought to be highly unreliable as a predictor of inflation.2 Market-based measures of inflation expectations seem to do a better job of predicting inflation. In this regard, inflation expectations embedded in Treasury securities have moved steadily higher in 2018. Expected inflation over the next five years and over the next 10 years has averaged 1.95 percent and 2.07 percent, respectively, since the start of 2018. However, both year-to-date averages are up only 20 basis points since their averages in the fourth quarter of 2017.
Research assistance was provided by Brian Levine, a research associate at the Federal Reserve Bank of St. Louis.
Endnotes
- Unless noted otherwise, annual percentage increases in output and prices are changes from the fourth quarter of one year to the fourth quarter of the following year. [back to text]
- See this recent presentation by St. Louis Fed President James Bullard at www.stlouisfed.org/~/media/Files/PDFs/Bullard/remarks/2018/Bullard_KU_Outlook_Conference_Lexington_KY_6_February_2018.pdf?la=en. [back to text]
Views expressed in Regional Economist are not necessarily those of the St. Louis Fed or Federal Reserve System.
For the latest insights from our economists and other St. Louis Fed experts, visit On the Economy and subscribe.
Email Us


