


The Relationship between Oil and Equities at the Zero Lower Bound
KEY TAKEAWAYS
- The correlation between changes in oil prices and equity returns increased sharply when the Fed’s policy rate became zero in 2008.
- Some economists believe that this phenomenon was the result of a change in how monetary policy worked at the zero lower bound.
- A study of other countries, however, indicates that this increased correlation didn’t occur when their policy rates became zero.

Economists have observed that the correlation between oil price changes and equity returns changed dramatically after 2008. Before 2008, oil and equity prices were generally uncorrelated, while after 2008 they became highly correlated.
Interestingly, this change in the correlation coincides with the Federal Reserve’s monetary policy transition to the zero lower bound (ZLB), in which the Fed’s policy rate—the federal funds rate—became zero. In other words, before 2008, the fed funds rate was positive, and oil price changes were uncorrelated with equity returns. Then on Dec. 16, 2008, the fed funds rate became zero, and changes in oil prices became highly correlated with changes in the return on equity.
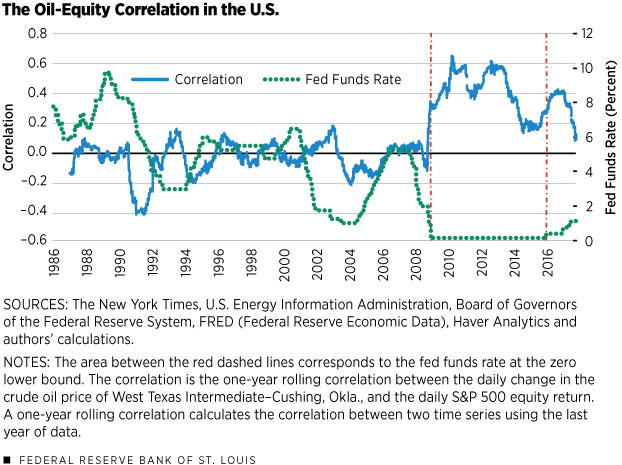
Figure 1 plots this rolling correlation alongside the fed funds rate.1 The left axis shows the correlation coefficient between the change in oil prices and the change in the Standard and Poor’s 500 Index return, and the right axis corresponds to the fed funds rate.
More specifically, the correlation between changes in oil prices and changes in the return on equities was essentially zero before the ZLB. However, the correlation spiked significantly just before the zero lower bound was reached, and the increased correlation persisted during the ZLB. (See the period between the red dashed lines on Figure 1.) Indeed, the average rolling correlation was only –0.04 before the ZLB, but averaged 0.40 during the ZLB.2 Also, we see that as the fed funds rate increased from zero starting in late 2015, the correlation between oil and equities eventually declined, although it is still too soon to make any predictions that price changes in oil and equity will become uncorrelated again.
Given this coincidence between the ZLB and the increased correlation, it is worth asking whether being at the ZLB may be the cause for the increased correlation. Datta, Johannsen, Kwon and Vigfusson tackled exactly this question.
Using a new-Keynesian model augmented to include oil, they concluded that, yes, being at the ZLB can be the cause for the increased correlation.3
The intuition behind their result is the following: When the monetary authority is constrained by the ZLB (i.e., the policy rate is set at zero, effectively setting the short-term nominal interest rate at zero), it cannot use the fed funds rate to respond to changes in inflation. The opposite is true away from the ZLB: The nominal rate changes in response to changes in inflation.
This intuition follows from the Fisher equation, in which the nominal interest rate approximately equals the real interest rate plus the inflation rate. Away from the ZLB, the monetary authority can respond to inflation by adjusting the policy rate. However, at the ZLB, the monetary authority cannot respond to decreases in inflation by lowering the policy rate; therefore, the nominal rate is essentially fixed, and the real interest rate has to adjust for the Fisher equation to hold.
This model-implied mechanism means that changes in inflation affect the real interest rate differently at the ZLB and away from it, and hence, it makes sense that the transmission to output, consumption, oil prices and equity prices is different at the ZLB and away from it.
An Alternative View
However, if the argument in Datta et al. is right, and the mechanism that changes the correlation between the change in oil prices and the change in equity prices is through a country’s inability to respond to inflation using the nominal interest rate, we should expect a consistent pattern at a cross-country level. That means the increased correlation should coincide with a country’s policy rate being at zero, as we observe for the U.S.
Figure 2 shows data similar to those plotted in Figure 1 for the United States, but for the U.K., France, Sweden and Japan. For these plots, we used each country’s own stock exchange index for equity returns4 and the relevant policy nominal interest rate.5,6
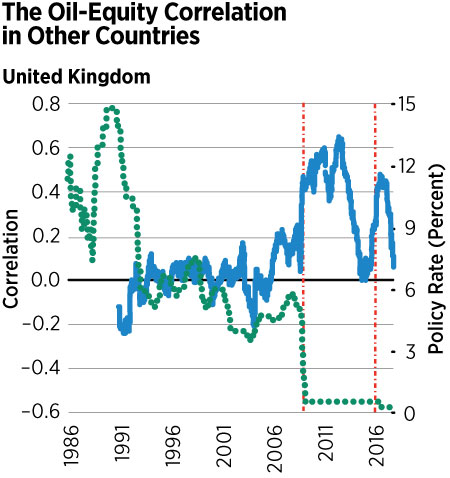
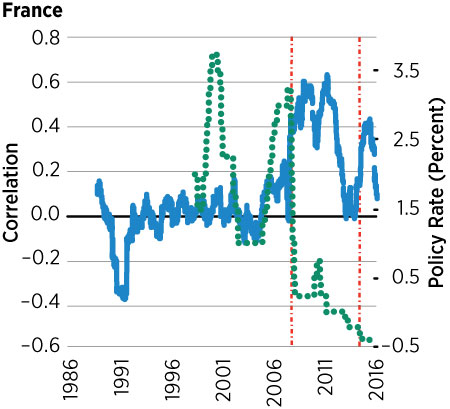
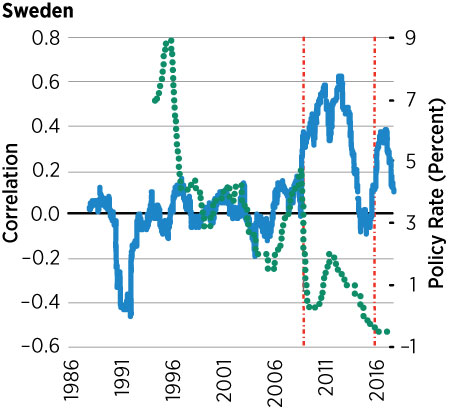
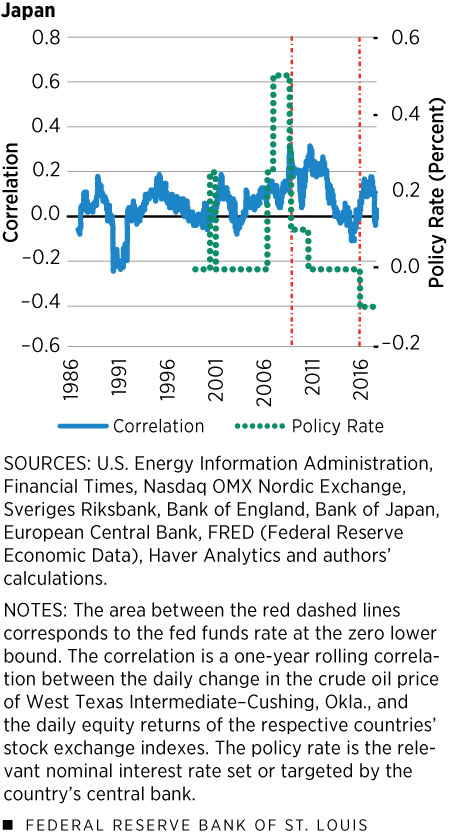
We can see that for all countries except Japan, the correlation between the growth rate of oil and equity prices oscillates around zero up to 2008 and then becomes positive up to around 2012, just as in the U.S. However, their policy rates were not at the zero lower bound. For those that did reach the ZLB, they reached it around 2012, with the exception of Japan, which went to the ZLB in the early 2000s. Interestingly, we do not see a global spike in oil-equity correlations coinciding with Japan entering the ZLB.
This cross-country evidence hints to the fact that the inability of the monetary authority to react to deflationary shocks does not explain the change in the correlation between oil and equity prices. If this were the right argument, we would observe a coincidence between the correlation becoming positive and the policy rate becoming zero for all these countries, which is not the case. (See Figure 2.)
However, the increase in the correlation for all countries coincides with the one in the U.S. This is because the stock exchanges in these countries are highly correlated with the S&P 500 and the price of oil is the same. This means that this is a more general phenomenon that seems to be related more to the policy rate of the U.S. than to the policy rate of each individual country.7
Endnotes
- We use the West Texas Intermediate–Cushing, Okla., for the crude oil index, and we use the S&P 500 for the equity index. We then calculate the daily price change in oil and the S&P 500 return using 100 times the log-difference of consecutive prices. Finally, we calculate the one-year rolling correlation between the daily change in oil prices and the daily S&P 500 return. A one-year rolling correlation calculates the correlation between two time series using the last year of data. This allows us to see whether there is any time variation in the correlation between oil and equities. [back to text]
- A correlation coefficient of 1.0 means the two variables are perfectly positively correlated, a correlation of –1.0 means the two variables are perfectly negatively correlated, and a correlation coefficient of 0.0 means no correlation. [back to text]
- See Datta et al. [back to text]
- For the equity indexes, we used the Paris CAC 40 for France, London Financial Times All-Share for the U.K., the Stockholm Affarsvarlden for Sweden, and the Nikkei 255 for Japan. [back to text]
- For nominal interest rates, we used the Bank Rate set by the Bank of England for the U.K., the overnight deposit rate set by the European Central Bank for France, the repo rate set by the Sveriges Riksbank for Sweden and the overnight deposit rate on excess reserves set by the Bank of Japan for Japan. [back to text]
- We use the West Texas Intermediate–Cushing, Okla., for the crude oil index, and we use each country’s respective equity index. We then calculate the daily price change in oil and the equity return using 100 times the log-difference of consecutive prices. Finally we calculate the one-year rolling correlation between the daily change in oil prices and the daily equity return. [back to text]
- One might wonder whether quantitative easing (QE) might have had something to do with this phenomenon. However, we do not believe that this is the case. The periods for QE1, QE2 and QE3 were fairly close together—constantly increasing the Fed’s balance sheet—and there is no systematic behavior for the correlation between the price of oil and the price of equity that can be observed for those periods. QE1 occurred from December 2008 to March 2010, QE2 occurred from November 2010 to June 2011, and QE3 occurred from September 2012 to October 2014. See Williamson. [back to text]
References
Datta, Deepa; Johannsen, Benjamin K.; Kwon, Hannah; and Vigfusson, Robert J. Oil, Equities, and the Zero Lower Bound. BIS Working Papers No. 617, Bank for International Settlements, March 2017.
Williamson, Stephen D. Quantitative Easing: How Well Does This Tool Work? Regional Economist, Third Quarter 2017, Vol. 25, No. 3, pp. 8-14.


Views expressed in Regional Economist are not necessarily those of the St. Louis Fed or Federal Reserve System.
For the latest insights from our economists and other St. Louis Fed experts, visit On the Economy and subscribe.
Email Us