


Income and Living Standards within the Eighth District
KEY TAKEAWAYS
- The paycheck itself doesn’t provide a complete picture of one’s lifestyle since cost of living can vary geographically.
- Regional price parity indexes can measure differences in the cost of living across regions.
- The District’s cost of living is about 15 percent below the national average, though this level varies among its counties.

Income inequality has long been an important issue in welfare economics. However, solely looking at income tells only part of the story about the differences in people’s living standards because income does not reveal information about the cost of living, i.e., the actual purchasing power of a person’s income.
For example, housing prices vary immensely across the country as well as across urban, suburban and rural areas. Since housing typically consumes a large share of an individual’s income, a high income does not necessarily translate to a high standard of living if housing is very expensive.
In other words, the purchasing power of a dollar is not the same across regions due to variations in the cost of living. Therefore, factoring in cost of living can yield fruitful insights about true inequality. In this article, we look at income adjusted for cost of living in the Eighth District1 to evaluate income inequality, or more accurately, living-standard inequality.
Real Per Capita Income in the District
Many are familiar with the consumer price index (CPI) and the personal consumption expenditures price index (PCEPI). These temporal indexes are useful for gauging the nationwide consumption price level and its changes over time, but they do not tell us much about the cost of living among different regions.
For example, without taking into account the heterogeneity of the cost of living, we find that the average 2015 PCEPI-adjusted per capita personal income by county for the District is about $31,000, which is well below the U.S. average of $43,996; the gap is about $13,000, or 30 percent.2 However, as the analysis below shows, the living standard in the District is much closer to the national average than suggested by per capita income per se.
Regional Price Parity Indexes and Cost of Living in the District
Recently, the Bureau of Economic Analysis (BEA) developed regional price parity indexes (RPPs) to facilitate the measurement of living standards across regions. The RPP is a spatial index that allows us to compare prices of consumption goods and housing across regions. The BEA has RPPs by state, metropolitan statistical area (MSA) and nonmetropolitan area. RPPs are constructed to compare prices relative to the national average. Therefore, the RPP for the nation is 100.
The 2015 RPP for every MSA and nonmetropolitan area in the District is less than 100, so cost of living is lower in the District relative to the nation. The average RPP is 86.6 and the median RPP is 85.6, suggesting that the cost of living in the District is about 15 percent below the national average.
But the cost of living is not even across the region. For example, the MSA with the lowest RPP is Jonesboro, Ark., at 81.9, and Columbia, Mo., has the highest RPP at 92.2. Also, nonmetropolitan, or more rural, areas tend to have lower RPPs and thus a lower cost of living.
Living Standard or Income-Adjusted for Cost of Living
Now we take county-level real per capita income and adjust it for cost of living. However, the BEA does not provide RPPs by county, so we adjust counties that belong to an MSA by their MSA’s RPP, and we adjust counties outside an MSA by their states' respective nonmetropolitan RPPs. Table 1 reports income adjusted for cost of living in the District for the top five and bottom five counties.
Adjusted Real Per Capita Income by County: Top Five and Bottom Five
| Rank | County | State | MSA Name | Regional Price Parity Index, 2015 | RPP-Adjusted Per Capita Personal Income* |
|---|---|---|---|---|---|
| 1 | Benton | Arkansas | Fayetteville-Springdale-Rogers, AR-MO | 89.8 | $79,678 |
| 2 | St. Louis | Missouri | St. Louis, MO-IL | 90.6 | $62,314 |
| 3 | Oldham | Kentucky | Louisville, KY-IN | 91.2 | $55,023 |
| 4 | Dubois | Indiana | Nonmetropolitan Portion | 85.3 | $53,895 |
| 5 | Monroe | Illinois | St. Louis, MO-IL | 90.6 | $52,090 |
| 334 | Benton | Mississippi | Memphis, TN-MS-AR | 91.5 | $27,641 |
| 335 | Lincoln | Arkansas | Pine Bluff, AR | 83.5 | $26,483 |
| 336 | Shannon | Missouri | Nonmetropolitan Portion | 84.4 | $26,089 |
| 337 | Lake | Tennessee | Nonmetropolitan Portion | 84.4 | $26,068 |
| 338 | Douglas | Missouri | Nonmetropolitan Portion | 84.4 | $25,771 |
*Chained 2009 dollars
SOURCES: Bureau of Economic Analysis, Haver Analytics and authors' calculations.
As expected, standard of living is not the same across the District. The average 2015 RPP-adjusted real per capita personal income by county is $36,482, compared with the national average of $43,996.3 Now the gap between the District and the national average shrunk dramatically from about $13,000 in PCEPI-adjusted terms to about $7,500. Namely, due to the District’s low cost of living, we see the gap narrow between the District’s “income” and the nation’s.
This result is similar to what St. Louis Fed President James Bullard has demonstrated about the importance of adjusting income for cost of living across MSAs in the U.S.4,5
However, inequality remains: The “richest” county commands a living standard more than 300 percent of that in the “poorest” county. For example, the living standard in St. Louis County, Missouri, is $62,314, and the living standard in Benton County, Arkansas, is $79,678. Still, despite these outliers, the living standard is relatively consistent across most counties in the District.
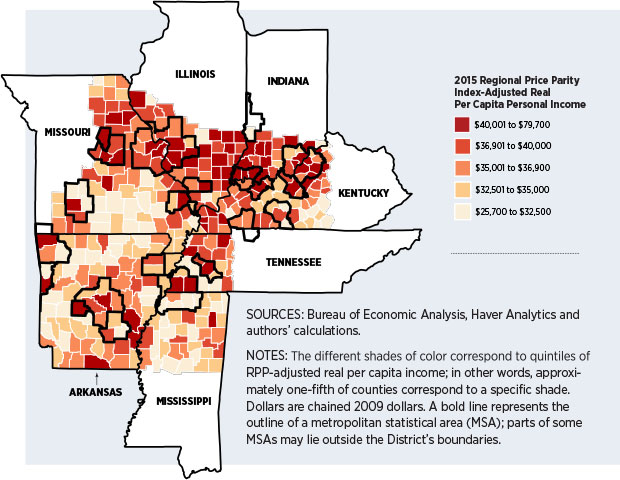
Figure 1 displays 2015 RPP-adjusted real income per capita on a map of the District so that we can better visualize the distribution of the standard of living geographically. The darker a county is, the higher its standard of living is. For example, southern Indiana has a relatively high standard of living, with median RPP-adjusted real income at around $41,000, while northern Mississippi has a relatively low standard of living at $33,000.
We also see that counties within MSAs tend to have higher adjusted incomes despite the fact that nonmetropolitan areas tend to have a lower cost of living. This suggests that income levels tend to rise more than proportionately with the cost of living, so that high-income regions tend to also have a high standard of living despite the higher cost of living.6
For Further Research
Our analysis allows us to see heterogeneity in living standards—the purchasing power of incomes—across the District and its relative position in the nation, but we would have greater insight into cost of living if we had RPPs by county. Also, within each county, both income and cost of living can vary substantially. For example, income and cost of living vary significantly between urban and rural areas. Therefore, finer micro-data would allow for a greater understanding of income inequality within a county.
Conclusion
In this article, we have looked at the distribution of living standards in terms of the purchasing power of real per capita personal income by county using RPPs. Adjusting income for cost of living allows us to evaluate inequality in income’s local purchasing power instead of income per se. We see that overall inequality is not so severe in the District once adjusted for the cost of living, both across counties and in comparison to the nation. We also see that living standards tend to be higher within MSAs than outside them. In general, inequality is less severe when measured by living standards than by income per se. Still, finer micro-data is necessary to better understand heterogeneity within each county.
Endnotes
- Headquartered in St. Louis, the Eighth Federal Reserve District includes all of Arkansas and parts of Illinois, Indiana, Kentucky, Mississippi, Missouri and Tennessee. [back to text]
- See Coughlin, Gascon and Kliesen. [back to text]
- The RPP national real per capita personal income is the same as the non-RPP-adjusted national real per capita personal income because RPPs are constructed to be 100 for the nation. [back to text]
- See Bullard, 2017, and Bullard, 2018. [back to text]
- Bullard also shows that MSAs with low incomes may in fact have higher living standards than MSAs with higher incomes when adjusting for RPP. [back to text]
- The average 2015 RPP-adjusted real per capita personal income for District counties within MSAs is $38,734.92, while the average for District counties outside of MSAs is $35,688.72. [back to text]
References
Bullard, James. Comparing Living Standards across U.S. Metro Areas: Which Ones Fared Well? Regional Economist, March 1, 2018. See www.stlouisfed.org/publications/regional-economist/first-quarter-2018/comparing-living-standards.
Bullard, James. Living Standards across U.S. Metropolitan Statistical Areas. Keynote address at the Bi-State Development 2017 Annual Meeting, St. Louis, Mo., Oct. 6, 2017.
Coughlin, Cletus; Gascon, Charles; and Kliesen, Kevin. Living Standards in St. Louis and the Eighth Federal Reserve District: Let’s Get Real. Federal Reserve Bank of St. Louis’ Review, 2017, Vol. 99, No. 4, pp. 377-394.
U.S. Bureau of Economic Analysis. Real Personal Income and Regional Price Parities, July 2016. See www.bea.gov/regional/pdf/RPP2016_methodology.pdf.


Views expressed in Regional Economist are not necessarily those of the St. Louis Fed or Federal Reserve System.
For the latest insights from our economists and other St. Louis Fed experts, visit On the Economy and subscribe.
Email Us