Tracking the U.S. Economy with Nowcasts
For policymaking purposes, the Federal Open Market Committee (FOMC) regularly communicates to the public that its policy is "data-dependent."1 This means that the stance of monetary policy will depend on the current and prospective performance of the economy.2 Forecasting, then, is a key aspect of monetary policymaking. But analyzing the performance of a large economy like that of the United States is difficult. To do this effectively, policymakers must confront several challenges, including evaluating the incoming flow of information that is contained in economic announcements or financial conditions. In recent years, economists have developed models to forecast the U.S. economy's performance in response to the regular flow of data. Since this process is an attempt to forecast the economy's performance in real time ("now"), these models are sometimes called "nowcasts."
The Basics of Nowcasting
On an average business day, government statistical agencies or private-sector organizations release reports that provide a snapshot of economic conditions over the previous day, week, month or quarter. Nowcasting, as is typically practiced, is the process of using the latest available economic information to forecast current-quarter growth in real (inflation-adjusted) gross domestic product (GDP).3 There are several methods to do this. One method is to track the forecast for the growth of real GDP in a given quarter based on the monthly consensus forecasts of private-sector forecasters published in the Blue Chip Economic Indicators (BCEI).4
For instance, suppose an economic analyst in late 2014 was interested in forecasting the growth of real GDP in the fourth quarter of 2015 (a year in advance). One method would be to first assess how the forecast for fourth-quarter real GDP growth has evolved over time in response to the data flows. If the data were consistently better than expected, then this could be a signal that the economy was developing some forward momentum; of course, the opposite is equally true. This information would have been reflected in the forecast consensus, resulting in either progressively stronger or weaker forecasts for fourth-quarter real GDP growth. This approach is sometimes called forecast tracking.5
The main drawback of this approach is that forecasts for the growth of real GDP several quarters in the future usually change very little from month to month. An exception would be if monetary policymakers unexpectedly alter their policy stance or fiscal policymakers enact unexpected changes to tax rates or to the path of government expenditures.
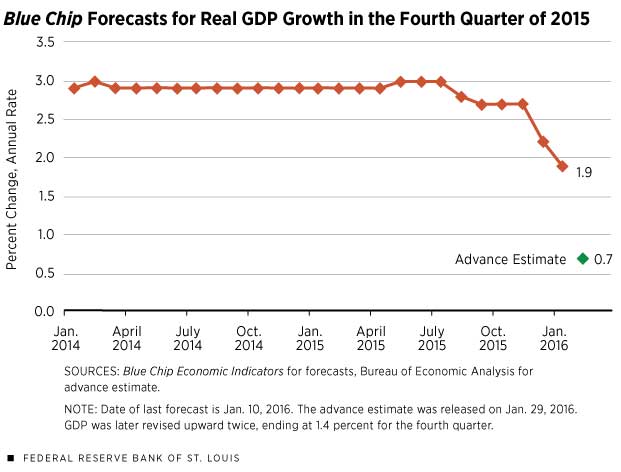
Figure 1 plots the Blue Chip Consensus forecast for the growth of real GDP in the fourth quarter of 2015 (2015:Q4) since the inaugural forecast was reported in the January 2014 issue of the BCEI. As Figure 1 shows, the forecasts for the growth of real GDP in 2015:Q4 changed very little until fall 2015.
There are a couple of takeaways from Figure 1. First, either the data flows over most of this period aligned with the expectations of forecasters, which meant that they had little reason to change their forecast, or, second, forecasters did not adjust their forecast until they saw the data that had the greatest bearing on 2015:Q4 real GDP growth.
The second explanation seems the most plausible. Accordingly, economists have developed economic models that attempt to exploit the information flows in the period that is being forecast. In this example, forecasters would use the data that are actually used in the construction of real GDP in 2015:Q4. This means using data that measure economic activity in October, November and December 2015. The essence of nowcasting, then, is to use these data when they are released to the public in November 2015, December 2015 and January 2016.6 Thus, as shown in Figure 1, the forecast for fourth-quarter real GDP growth that was made in early January 2016 was 1.9 percent, but this forecast was made with an incomplete set of data for the fourth quarter. In late January, when the Bureau of Economic Analysis (BEA) released the advance estimate, real GDP growth was shown to be only 0.7 percent. The advance estimate was subsequently revised upward twice, ending at 1.4 percent.
There are many types of nowcasting approaches. For example, some models, like those developed by the private-sector forecasting firm Macroeconomic Advisers and by the Federal Reserve Bank of Atlanta, produce forecasts for real GDP growth and its major components, such as personal consumption expenditures and nonresidential fixed investment. These kinds of models generally also employ a GDP accounting approach that is based on key data releases, such as the Census Bureau's reports on auto sales, construction spending, or monthly exports and imports. These underlying data are known as "source data" because they are used by the BEA to compile its quarterly estimates of GDP and its components.7
Limitations of Nowcasts
Users of nowcast models must be aware of several limitations. First, most of the monthly source data are initially sample-based estimates. This means, in effect, that the initial estimates are subject to repeated revision as new information becomes available. A second limitation, as inferred from above, is that there are many types of nowcasting models. And since no single approach seems to dominate all others all of the time, it is probably prudent to look at a variety of models when attempting to assess the performance of the economy in real time. The third limitation is that the advance estimate of real GDP growth relies on an incomplete set of source data. According to the BEA's Technical Note released on Jan. 29, 2016, the fourth-quarter 2015 estimate of real GDP was calculated using assumptions for several series in December 2015, including residential and nonresidential construction, and certain wholesale and retail inventories.8 Thus, a forecaster who is attempting to estimate the advance estimate of fourth-quarter real GDP using a source-based approach will have to similarly use some method to fill in these missing values.
Comparing Nowcasts
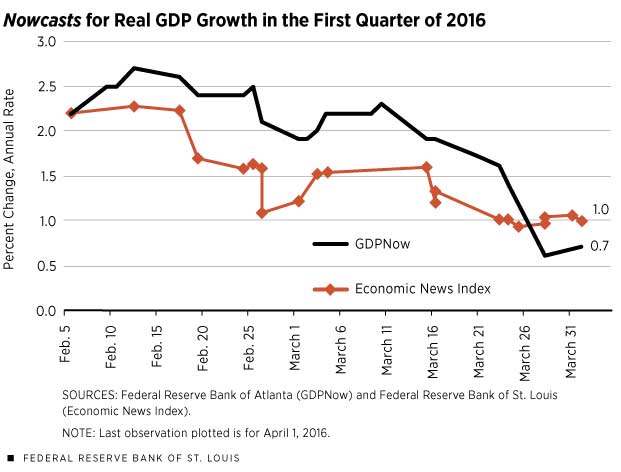
Several consulting firms and Wall Street financial institutions regularly produce nowcasts. However, few are freely available to the public. Figure 2 shows two nowcasts for real GDP growth for the first quarter of 2016. The first nowcast is the GDPNow series from the Federal Reserve Bank of Atlanta. The Atlanta Fed's model marries two common approaches used in the academic literature: the GDP accounting approach and a sophisticated statistical forecasting exercise used to fill in missing data during the nowcast quarter.9
The second nowcast uses a completely different model and methodology. This nowcast is currently being used internally at the Federal Reserve Bank of St. Louis; a forthcoming article will unveil and outline this approach.10 Briefly, the St. Louis Fed's approach creates a simple-to-read index—called the Economic News Index (ENI)—that uses the economic content from key monthly economic data releases to estimate the growth of real GDP during that quarter.
The uniqueness of the ENI is that (1) it incorporates data that do not directly flow into the calculation of real GDP (source data); and (2) the economic data are weighted relative to their importance in predicting real GDP growth during the quarter. Since there are numerous releases of the same data series in the quarter—for example, monthly retail sales or industrial production—the ENI will also determine whether previous releases should be discounted or weighted more heavily.11 Unlike the GDPNow measure, the ENI will not produce forecasts for the major components of GDP, such as real nonresidential fixed investment.
Figure 2 plots these two nowcasts for the first quarter of 2016 using the available data as of April 1. Accordingly, the GDPNow model forecast that real GDP would increase at a 0.7 percent annual rate, while the ENI was predicting growth of 1 percent. The evolving nature of these two nowcasts reflects both the promise and the peril of forecasting in real time: the promise of a clearer signal of current economic conditions, and the peril of relying on data that are often volatile and subject to revision.
Research assistance was provided by Joseph T. McGillicuddy, a research associate at the Bank.
Endnotes
- For example, in the Dec. 16, 2015, FOMC press release, the committee noted that "the actual path of the federal funds rate will depend on the economic outlook as informed by incoming data." See http://www.federalreserve.gov/newsevents/press/monetary/20151216a.htm. [back to text]
- Four times per year, the participants of the Federal Open Market Committee (FOMC) release their economic projections for real gross domestic product (GDP) growth, inflation and the unemployment rate, as well as their expectation for the federal funds rate at the end of the current year and several subsequent years. These are known as the Summary of Economic Projections (SEP). The latest version of the SEP can be found at http://www.federalreserve.gov/monetarypolicy/fomcprojtabl20151216.htm. [back to text]
- In principle, one could also produce nowcasts for inflation or other economically important series. [back to text]
- These are known as consensus forecasts because they report the average of all forecasts for a given economic variable in a given forecast quarter. The Blue Chip Economic Indicators surveys about 50 private forecasters. [back to text]
- The Blue Chip Consensus forecast tracking method relies on the average of several different forecasting models. These models may be dissimilar in their sophistication and/or methodology. [back to text]
- This process varies in its sophistication. For those so inclined, see Banbura, Giannone, Modugno and Reichlin for an academic treatment. [back to text]
- The BEA keeps two accounts. The first measures the dollar value (both in current dollars and in chain-weighted, or real, dollars) of expenditures on goods, services and structures (GDP) produced in the United States. The second account measures the income that flows to the owners of the factors of production (labor, land and tangible capital) used to produce the output and expenditures measured by GDP. The latter is termed in gross domestic income (GDI). In theory, GDP and GDI should equal each other. In practice, they differ by an error term called a residual. The data are also adjusted to remove any regularly occurring seasonal variation. We will focus on the expenditure-side estimate (GDP) in this article. [back to text]
- See the Technical Note at http://bea.gov/newsreleases/national/gdp/2016/pdf/tech4q15_adv.pdf. [back to text]
- See the Federal Reserve Bank of Atlanta's GDPNow page for the current-quarter forecast and a link to a technical paper that describes the methodology. See the page at https://www.frbatlanta.org/cqer/research/gdpnow.aspx?panel=1. [back to text]
- See Grover, Kliesen and McCracken. [back to text]
- To be clear, most data are released with a one-month lag. Thus, data that measure economic activity in January are typically released in February. [back to text]
References
Banbura, Marta; Giannone, Domenico; Modugno, Michele; and Reichlin, Lucrezia. "Now-Casting and the Real-Time Data Flow," in Graham Elliott and Allan Timmermann, eds., Handbook of Economic Forecasting. Vol. 2A. Chap. 4. Amsterdam, Netherlands: Elsevier B.V., 2013.
Grover, Sean P.; Kliesen, Kevin L.; and McCracken, Michael W. "A Macroeconomic News Index for Constructing Nowcasts of U.S. RGDP Growth," Federal Reserve Bank of St. Louis' Review, 2016 (forthcoming).
Views expressed in Regional Economist are not necessarily those of the St. Louis Fed or Federal Reserve System.
For the latest insights from our economists and other St. Louis Fed experts, visit On the Economy and subscribe.
Email Us


