


The Ups and Downs of Inflation and the Role of Fed Credibility
"With inflation running below many central banks' targets, we see rising risks of deflation, which could prove disastrous for the recovery. If inflation is the genie, then deflation is the ogre that must be fought decisively."
—Christine Lagarde, managing director of the International Monetary Fund, in a speech Jan. 15, 2014, to the National Press Club in Washington, D.C.
In this speech, Christine Lagarde urged central banks in major developed nations to stick with low interest policies in order to fight off the threat of deflation. Expectations of deflation are detrimental to recovering economies. If consumers know prices will drop in the future, they will hold back spending in the present, further depressing the economy. But what should central banks do if the low interest rate policies are actually causing inflation that is so low it raises the specter of deflation?
There are two ways that a central bank can cause low interest rates to be associated with low inflation. The first is if a central bank pursues a lower inflation target, whether by design or indirectly; in this case, people's expectations of lower inflation may lead to both lower interest rates and lower inflation. The second way is by targeting the key policymaking interest rate (such as the federal funds rate in the U.S.) to a level that is too low for too long to be consistent with the central bank's inflation target. The fed funds rate, which is the overnight interest rate at which a depository institution lends funds at the Federal Reserve to another institution, currently has a target of 0 to 0.25 percent. But the Fed's inflation target is 2 percent. Since the Fed set that inflation target in January 2012, the inflation rate has generally been below the target.
Understanding the cause of unusually low inflation is necessary to forming a policy to fix it. The conventional wisdom, that lower interest rates today will cause higher inflation tomorrow, comes from historical experience with a monetary policy that was not credible. By credible monetary policy, we mean that the public believes that the central bank will do whatever is necessary to achieve long-run price stability. When a central bank is not credible, it is always fighting inflation—as the Fed had to do in the 1970s.
Earning credibility can be very costly. The recessionary period from early 1980 through 1982 was associated with policies that were adopted to control inflation and earn credibility. The benign period of growth that began in the mid-1980s is often attributed to the fact that monetary policy had gained credibility.
In this article, we look at the history of interest rates and inflation in the U.S. to clarify ideas about monetary policy and credibility. We examine three periods corresponding to three distinctly different policies associated with monetary policy: 1) operating without credibility, 2) earning credibility and 3) operating with credibility. After clarifying how credibility matters for interest rates and inflation in these three episodes, we turn to current events to discuss why low interest rates may now be putting downward pressure on inflation rates.
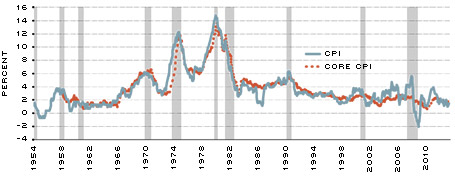
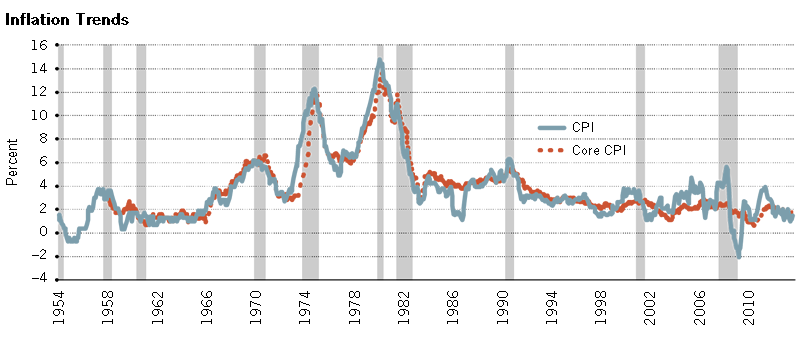
Inflation Trends
SOURCE: U.S. Bureau of Labor Statistics.
NOTE: The consumer price index (CPI) measures monthly changes in the prices paid for a representative basket of goods and services. The core CPI excludes food and energy. The gray bars indicate recessions.
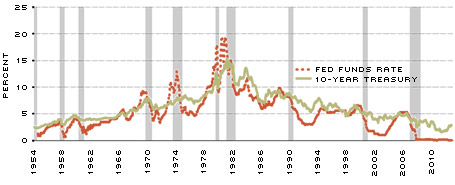
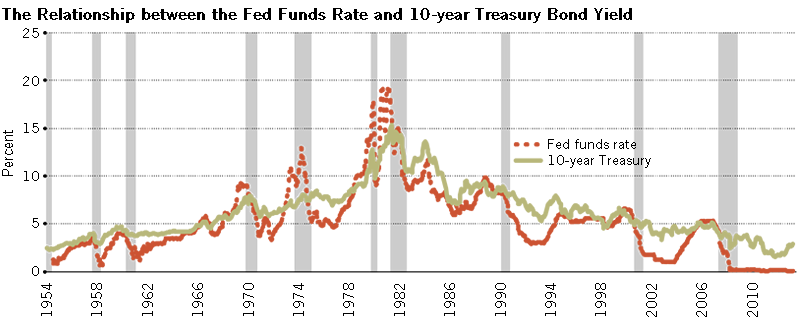
The Relationship between the Fed Funds Rate and 10-Year Treasury Bond Yield
SOURCES: Federal Reserve Board and U.S. Treasury.
NOTE: The changing nature of the relationship between the fed funds rate (short-term rate) and the 10-year Treasury bond yield (long-term rate) is indicative of three distinctly different eras associated with U.S. monetary policy: pre-1980, 1980-1986 and 1987-today. The gray bars indicate recessions.
Pre-1980: No Credibility
During the 1970s, the U.S. experienced a period of accelerating inflation that came to be known as the Great Inflation.[1] Figure 1 shows that inflation rose in fits and starts from just under 2 percent in 1965 to 14.4 percent in June 1980. This period was often characterized as an era of stop-go monetary policy. When inflation rose, the Fed's chief monetary policymaking body, the Federal Open Market Committee (FOMC), would react by raising the fed funds rate high enough to slow inflation. The relatively high interest rate would lower aggregate spending, reduce the demand for labor and lead to a recession. The FOMC would then switch gears, lowering the fed funds rate sharply to stimulate spending and job growth. The stop-go nature of this policy before 1980 is evident in Figure 2, which shows the fed funds rate (a short-term rate) and the yield on 10-year Treasury bonds (a long-term rate) from 1954 through 2013.
The relationship between the fed funds rate and the 10-year Treasury rate during the period before 1980 displays three distinct features. First, both interest rates display rising trends and have roughly equal average rates; the fed funds rate averaged just 0.6 percent less than the 10-year rate. Second, the fed funds rate was sometimes as much as 2 percentage points higher than the 10-year rate, which signaled a poor long-term outlook. Third, periods of relatively low interest rates were followed by higher inflation and inflation expectations, reflected in rising 10-year bond yields.
The lack of credibility also made setting the fed funds rate above the 10-year rate necessary in order to slow inflation expectations. When the FOMC raised interest rates too slowly, inflation expectations would rise to match the rise in interest rates, and there was no dampening effect on either the economy or inflation. The lack of credibility meant that to succeed in lowering inflation, the FOMC had to raise the fed funds rate high enough to slow the economy. This led to a belief that stabilizing inflation would likely lead to high unemployment. A corollary to this idea was that low interest rates would raise inflation and, at the same time, lower the unemployment rate. What has not been generally recognized is that these dynamic relationships came to be part of conventional wisdom in macroeconomics when we were looking at data generated in a period without credibility.
The lack of credibility caused inflation to rise when interest rates were low. In the stop-go policy, the FOMC adjusted interest rates in response to both unemployment and inflation. Gaining credibility would require a period of prioritizing low inflation over low unemployment. Only then would long-run inflation expectations be set in a way that did not fluctuate with short-term interest rate policy.
1980-86: Earning Credibility
In late 1979, the U.S. dollar was in crisis and European central bankers called on Fed Chairman Paul Volcker to find a way to end this period of high and rising inflation.[2] On Oct. 6, 1979, the FOMC announced that it was adopting a new procedure for monetary policy. Policymakers switched from targeting a narrow range for the fed funds rate to targeting a narrow range for bank reserves. Money demand—and, therefore, bank reserve demand—is highly volatile in the short run. By targeting the interest rate, the Fed allows money demand fluctuations to be absorbed by accommodating fluctuations in money supply. On a month-to-month basis before Oct. 6, 1979, the FOMC was setting the interest rate while the market was setting the quantity of reserves. As part of its new policy to end inflation, the FOMC announced that it would no longer set the interest rate, but rather would set the supply of reserves consistent with a target path for the money supply. This meant that the market would set the interest rate. Highly volatile money demand then created highly volatile interest rates.
The effect on interest rates of switching from an interest rate target to a target for bank reserves shows up in Figure 2 as a dramatic increase in both their level and volatility. Between January 1979 and December 1982, the standard deviation of monthly changes in the fed funds rate was 1.92 percentage points, while pre-Volcker, the monthly standard deviation was just 0.4 percentage points. In January 1981, the fed funds rate peaked at just over 20 percent on a weekly average basis. (Figure 2 shows monthly averages that dampen this weekly variation.)
After the recession ended in 1982, the FOMC was still worried about building credibility and once again raised interest rates in response to rising inflation. Figure 2 shows that the fed funds rate rose from 8.6 percent in May 1983 to 11.6 percent in August of 1984. This tightening occurred during a major banking crisis, which saw Continental Illinois National Bank and Trust Co., at one time the seventh-largest bank in the U.S. as measured by deposits, go into bankruptcy. During the crisis, the unemployment rate never fell below 7.2 percent. But the tighter policy was aimed at preserving the progress made on lowering inflation.
Keeping the policy rate high, despite high unemployment rates, convinced the public that the Fed would do whatever was necessary to maintain low inflation. The policy worked: Inflation fell sharply to a low of 1.1 percent in December 1986. The Fed gained credibility for its inflation expectations, although not without causing a severe recession and double-digit unemployment rates. What's most worrisome about the loss of credibility—at least in the eyes of those who lived and worked through this period—is the high cost of regaining it.
1987-2007: Operating with Credibility
Alan Greenspan became Fed chairman in June 1987. Soon after—on Oct. 19, 1987—the stock market crashed. The Fed flooded the market with about $600 million in excess reserves (which were withdrawn after a few weeks).[3] The economy weathered the crisis, and the Fed continued to raise the fed funds rate target to just under 10 percent in reaction to an inflation scare that was associated with the rise in the 10-year rate.[4] This uptick was only temporary, however, and marked the highest peak in inflation and interest rates from then until the present.
This period of low inflation and credible monetary policy was accompanied by dramatic changes in the relationship between the fed funds rate and the yield on 10-year Treasury bonds. Notice the contrast from the earlier period, as evident in both Figures 1 and 2. As inflation stabilizes at about 2 or 3 percent, interest rates continue to trend lower. Also, the fed funds rate is never much higher than the 10-year rate. Since January 1987, the fed funds rate has been, on average, 1.6 percentage points below the 10-year Treasury rate.
Perhaps the most surprising result occurred after Sept. 2, 1992. This was when the FOMC decided to set the fed funds rate target at 3 percent, a rate approximately equal to the perceived trend in inflation. The rate was held at this level for 16 months. It was felt that such a low interest rate for so long would cause higher inflation and, in October 1993, the 10-year rate began to rise from a low of 5.3 percent to a peak just under 8 percent in November 1994. But the FOMC did not have to raise the federal funds rate above the 10-year rate to end this brief inflation scare. The FOMC began to raise the fed funds rate target in February 1994. It was raised rather sharply to 6 percent in early 1995, but, by then, the 10-year rate had already begun to retreat. On a 12-month moving average basis, the consumer price index (CPI) inflation rate peaked at 2.9 percent in August 1994.
2008-13: The Financial Crisis and Unexpectedly Low Inflation
The Greenspan chairmanship ended in 2006. President George W. Bush appointed Ben Bernanke to replace Greenspan on Feb. 1, 2006. The Great Moderation of the Greenspan era began to fade almost immediately.
The housing boom began to cause serious financial distress in the summer of 2007 and eventually led to an all-out crisis with the bankruptcy of Lehman Brothers Inc. on Sept. 15, 2008. The FOMC flooded the market with bank reserves to prevent a worldwide collapse of financial markets. The flood of excess reserves drove the fed funds rate to 0; the FOMC followed on Dec. 16, 2008, by setting a target range for the fed funds rate at 0 to 0.25 percent.
This range has been held there for five years, and FOMC members expect it will stay there until sometime in 2015. As has been the case since Greenspan's experience with a low fed funds rate in 1992, the exceptionally low fed funds rate of today has not led to higher inflation. Indeed, the opposite has occurred, as inflation and inflation forecasts continue to track below the 2 percent target of the FOMC.
During the Great Inflation, when the Fed did not have credibility, it was difficult for the Fed to stop the rise of inflation. Now, when credibility is deeply rooted, it seems just as difficult to stop inflation from falling. Long-run inflation expectations appear to have stabilized at about 2 percent in this period; so, it seems highly unlikely that expectations about the Fed's target are the cause of low interest rates and below-target inflation today. To understand why low interest may be causing low inflation, we turn to the Fisher equation.
The Fisher Equation
Irving Fisher (1867-1947) is one of America's greatest monetary economists. An important reason for his fame is the Fisher equation, which links the nominal interest rate to the real interest rate through inflation expectations:
nominal interest rate = real interest rate + expected inflation rate
The Fisher equation is an accounting identity. The equation also helps us to think about how the Fed's interest rate policy may influence inflation. Nominal interest rates are the interest rates that people pay to borrow or that they earn on their savings accounts or bond holdings. The fed funds rate is an example of a nominal interest rate—it is the reported rate at which depository institutions (such as banks) lend funds on deposit at the Fed to other banks that also have accounts at the Fed. This rate is not adjusted for inflation. The real interest rate, on the other hand, is the rate of return that is earned after adjusting for inflation. When borrowers and lenders agree on the nominal interest rate, they do not know what inflation rates will be in the future. Instead, they set the interest rate based on their expectations of inflation. For example, suppose your price for lending $100 is a 3 percent increase in real purchasing power. Because you expect inflation to rise by 2 percent over the year, you and the borrower agree upon a nominal interest rate of 5 percent. If the actual rate of inflation was 3 percent, then the real interest rate would be only 2 percent.
After the fact, it's simple to calculate what the real rate of return of the loan was. Since the FOMC set the fed funds target at 0 to 0.25 percent, the Fed has paid 0.25 percent on bank deposits held as reserves; so, no bank with an account at the Fed has an incentive to lend funds at less than this rate. Since December 2008, inflation in the CPI has averaged 1.6 percent. This means the average real return on bank deposits at the Fed has been –1.35 percent.
Before the fact, the real interest rate is not as easy to measure. Except for the indexed bonds issued by the U.S. government, we do not have direct measures of the real interest rate.[5] Gross domestic product (GDP) growth adjusted for inflation, however, is a good indicator of real interest rate trends. When the economy is doing well, there is a higher return to a given amount of capital and labor; thus, real interest rates are higher. Between 2010:Q4 and 2013:Q4, year-over-year change in GDP averaged 2.21 percent. This positive growth is in stark contrast to the decline of 0.03 percent between 2007:Q4 and 2010:Q4. Since real output is increasing, real interest rates must be on the rise, as well. If the real interest rate is moving up and the nominal interest rate is being pegged near 0 by the Fed, then the Fisher equation predicts that there will be downward pressure on inflation.
Monetary policy has been much in the news because the 2007-09 recession was exceptionally deep, monetary policy was exceptionally easy and, yet, the recovery has been unusually tepid. Why has the Fed been keeping the policy rate low? Because the common belief is that low nominal rates will stimulate spending and push the economy toward recovery. However, the consistently low inflation forecasts across all major countries are disconcerting and make us suspect the Fisher equation is making itself felt in the data more than predicted. As major economies are recovering, we would expect real returns to rise. Therefore, according to the Fisher equation, with the fed funds rate near 0, the inflation rate would have to be negative. The low rates set by the Fed could actually be contributing to low inflation and low inflation expectations.
Looking Forward
There is a great deal of uncertainty about future monetary policy because the outlook for interest rates, inflation and real economic growth is inconsistent with the Fisher equation. The low interest rate outlook is inconsistent with 2 percent inflation expectations and a normal recovery. A normal recovery will lead to rising real interest rates and should make the nominal interest rate higher than the 2 percent coming from the inflation objective. The uncertainty arises because there are dramatically different ways that the inconsistency can be resolved. Consider three alternative scenarios:
- The Fed loses credibility, and we return to 1970s-style inflation. This is the concern of some FOMC members who have dissented on a regular basis. In this scenario, real interest rates continue to be low, but inflation expectations and the 10-year rate begin to rise rapidly. The Fed is forced to raise the fed funds rate as inflation accelerates. This seems an unlikely outcome, at least in the next year or two.
- The Fed maintains credibility, and people expect 2 percent inflation to continue indefinitely. The Fed is successful in engineering a recovery with a gradual rise in interest rates. Interest rates rise enough to prevent a loss of credibility, but not so much as to cause another recession. This is the outcome that is considered most likely by private and government economic forecasters.
- The Fed decides to keep rates exceptionally low until the economic data clearly demonstrate that the economy is at full employment. The problem with this scenario is that neither the Fed nor private-sector economists are able to predict turning points. The economy is likely to be well beyond ordinary measures of full employment before the data reveal that the threshold has been met. The Fisher equation suggests that keeping nominal rates low while the economy recovers will put downward pressure on inflation. In this scenario, interest rates and inflation stay well below normal for a long time. This outcome is more likely if forward guidance sets a lower threshold on the inflation target.
The reason it is so hard to predict which of these scenarios might play out is that the result depends so much on what people think will happen. Inflation expectations are the key. A surge in inflation expectations leads to the first scenario above. Expectations anchored at 2 percent will support the second scenario. Expectations of falling inflation or even of deflation are likely to lead to the third outcome, which is a concern because it looks so much like the Japanese economy from 1995 to the present.
Endnotes
- See Nelson, who explains why, during this period, many economists and policymakers did not feel that it was important for the Fed to focus sharply on price stability. [back to text]
- See Lindsey, Orphanides and Rasche for a description of events and policy actions taken at this time. [back to text]
- See Neely for a description of the Fed's reactions to crises in financial markets. [back to text]
- See Goodfriend for a description of inflation scares and the Fed's response to them. [back to text]
- See Fleming and Krishnan for a description of Treasury inflation-protected securities (TIPS). [back to text]
References
Fleming, Michael J.; and Krishnan, Neel. "The Microstructure of the TIPS Market." Federal Reserve Bank of New York Economic Policy Review, March 2012, Vol. 18, No. 1, pp. 27-45.
Goodfriend, Marvin. "Interest Rate Policy and the Inflation Scare Problem: 1979-1992." Federal Reserve Bank of Richmond's Economic Quarterly, Winter 1993, Vol. 79, No. 1, pp. 1-23.
Lindsey, David E.; Orphanides, Athanasios; and Rasche, Robert H. "The Reform of October 1979: How It Happened and Why." Federal Reserve Bank of St. Louis' Review, November/December 2013, Vol. 95, No. 6, pp. 487-542.
Neely, Christopher J. "The Federal Reserve Responds to Crises: September 11th Was Not the First." Federal Reserve Bank of St. Louis' Review, March/April 2004, Vol. 86, No. 2, pp. 27-42.
Nelson, Edward. "The Great Inflation of the Seventies: What Really Happened?" Federal Reserve Bank of St. Louis, Working Paper 2004-001.

Views expressed in Regional Economist are not necessarily those of the St. Louis Fed or Federal Reserve System.
For the latest insights from our economists and other St. Louis Fed experts, visit On the Economy and subscribe.
Email Us