Paying Down Credit Card Debt: A Breakdown by Income and Age
U.S. households started a deleveraging process as soon as the Great Recession began, which was in late 2007. They continued along this path until mid-2010. Among the different types of consumer debt (auto loans, credit card, student loans), this trend of paying down debt was particularly striking for credit card debt. Research on the reasons behind this trend is ongoing.[1] The increased risk during the crisis could have motivated financial institutions to extend less credit, but households also could have had a reduced willingness to borrow. This article documents how the deleveraging process regarding credit card debt varies across households with different backgrounds. It also decomposes changes across the variations in the share of people in debt (called "the extensive margin") and changes in the amounts of debt held by borrowers ("intensive margin").
Consumer Debt Service Payments

SOURCE: Federal Reserve Board.
NOTE: Income in this case refers to disposable personal income. Consumer debt includes outstanding credit extended to individuals for household, family and other personal expenditures, excluding loans secured by real estate. Data are seasonally adjusted.
Decomposition of Consumer Debt

SOURCE: Federal Reserve Bank of New York, Quarterly Report on Household and Credit, November 2013.
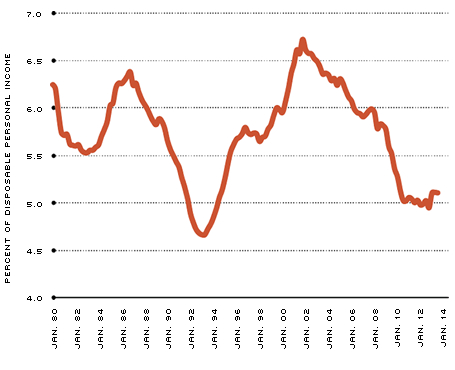
Figure 1 shows that, measured as a percentage of disposable personal income, scheduled consumer debt payments decreased from 6 percent at the beginning of the recession to about 5 percent in mid-2010. Since then, the rate has remained about 5 percent.
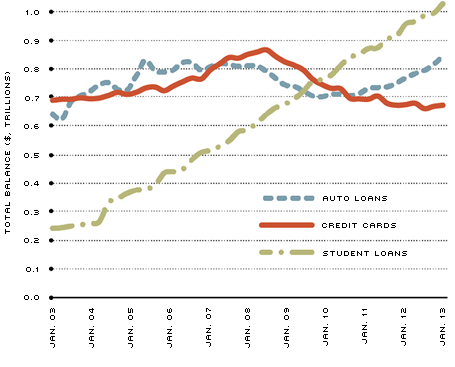
Consumer debt includes outstanding credit extended to individuals for household, family and other personal expenditures, excluding loans secured by real estate. Figure 2 shows the evolution of the main components: credit card debt, auto loans and student loans. The balances on auto loans, represented by the blue dashed line, decreased during 2008-2009 but recovered quickly, starting early in 2010. Student loans, represented by the green dashed line, increased continuously from 2003 until 2013. Credit card debt, represented by the red solid line, is the component that shows the clearest negative trend since the financial crisis. As a consequence, the rest of the article is focused on credit card debt.
The Federal Reserve's Survey of Consumer Finances (SCF) asks households about their outstanding obligations. The survey asks not just about the outstanding credit card debt but also about income and age of the head of households. In what follows, the changes in credit card debt are broken down by income and age. The focus will be on the years 2007 and 2010 because those years are the closest to the period of deleveraging in credit card debt for which SCF data are available. The definition of credit card debt is the amount of debt outstanding after the last payment; so, it does not contain the debt of those who pay the full amount every month.
Notice that changes in the mean level of debt of a group may be because the share of households with debt in that group changed or because the mean debt of those in debt changed. In economics, these changes are referred to as extensive and intensive, respectively. According to the SCF, mean credit card debt decreased 24 percent between 2007 and 2010, from $3,538 to $2,791.[2] Of this percentage drop, one-third (8 percent) was due to the intensive margin and two-thirds (16 percent) was due to the extensive margin. This decomposition is used below to characterize the borrowing behavior of different income and age groups.
Table 1 shows credit card debt for the years 2007 and 2010 by income groups. Each group contains 25 percent of the households. The first group, the poorest, had mean credit card debt of $1,013 in 2007. In the same year, the richest group had mean credit card debt of $6,103.
Not only is the dollar amount of debt for each group different in both 2007 and 2010, but the percentage change for each group between those two years is different. The middle groups, sometimes referred to as the middle class, are responsible for most of the deleveraging. While the first and fourth quartiles decreased debt by about 14 percent, the second and third income quartiles decreased credit card debt by 28 and 38 percent, respectively.
Except for the third income quartile, changes in debt are mainly due to the fact that fewer households are in debt. For instance, the richest households in debt decreased their mean debt by only 0.4 percent; so, most of the 14.6 percent decrease is due to the fact that fewer households in this group are in debt.
Table 2 shows credit card debt levels and changes between 2007 and 2010 for different age groups. There is a hump-shape profile of debt over the life cycle. For instance, in 2007 households in the age groups 18 to 37 and 63 to 95 had about half of the mean credit card debt of those in the age groups 38 to 49 and 50 to 62.
The changes in borrowing are very heterogeneous across different age groups. Households with a head of household ages 38 to 49 decreased borrowing by only
13 percent. In contrast, households headed by someone 18 to 37 decreased credit card debt by 28 percent, and households headed by someone older than 62 decreased credit card debt by 33 percent.
The relative importance of the intensive and extensive margins for households deleveraging varies across households of different ages, too. The extensive margin is more important for young households, for whom it accounts for more than 80 percent of the change. In contrast, for the oldest households, it is the intensive margin that accounts for more than 80 percent of the variation.
The data analyzed here reveal that although the deleveraging of U.S. households after the financial crisis was present across all types of households, it was actually more important for households with middle income that are younger than 38 or older than 62. In addition, the analysis shows that, except for some groups, most of the change in outstanding credit card debt is accounted for by changes in the share of households in debt—the extensive margin—and not by the amounts borrowed by those in debt—the intensive margin.
The findings in this article suggest that several factors may be behind the deleveraging. The worsening of labor market conditions, in particular the higher risk of unemployment, may account for some of the changes, especially those of young households with lower income. However, this factor is unlikely to account for the deleveraging by richer households headed by those older than 62. This seems to indicate that other factors, like shocks that increase the desire by older/richer households to save, may be necessary to understand the deleveraging.
Endnotes
- See Athreya et al. [back to text]
- Notice that this change does not take inflation into account. Thus, in real terms, the decline in borrowing was even larger. [back to text]
References
Athreya, Kartik; Sánchez, Juan M.; Tam, Xuan S.; and Young, Eric R. "Labor Market Upheaval, Default Regulations, and Consumer Debt." Working Paper No. 2014-002A, Federal Reserve Bank of St. Louis, January 2014. See http://research.stlouisfed.org/wp/2014/2014-002.pdf.
Views expressed in Regional Economist are not necessarily those of the St. Louis Fed or Federal Reserve System.
For the latest insights from our economists and other St. Louis Fed experts, visit On the Economy and subscribe.
Email Us


