


A View from the Fiscal Cliff
For a number of years now, there has been a renewed and ongoing debate in the U.S. about the proper role and size of government. On one side of the argument, distrust in markets has increased due to the severity of the 2007-08 financial crisis, particularly how it impacted household wealth. On the other side, distrust in government has increased, given the apparent ineffectiveness of stimulus programs and worries about mounting debt, both of which resulted from the government's response to the recession that followed. The disagreement in views promoted a situation in which federal revenue gradually fell well below historical averages while spending rose significantly.
These circumstances marked the negotiations to raise the debt ceiling in 2011. An important element of the agreement that was brokered during these talks was the establishment of a congressional "supercommittee" (officially, the Joint Select Committee on Deficit Reduction), whose job was to significantly reduce the deficit over the span of a decade. This bipartisan committee, however, failed to provide any deficit-cutting recommendations; that failure triggered a series of automatic deficit-reducing measures, as specified in the original agreement during the debt-ceiling negotiations.
Because of these measures, the federal deficit was projected toward the end of 2012 to drop sharply in the following years, fueling worries of depressed future economic activity in the context of a weak recovery from the previous recession. This sharp fiscal contraction, dubbed the "fiscal cliff" in the news, consisted of the expiration of various tax cuts, tax credits, unemployment insurance extensions and Social Security payroll tax relief; the decrease in Medicare payment rates to health-care providers; and automatic spending cuts, known as "sequestration." But on Jan. 1, 2013, Congress passed the American Taxpayer Relief Act of 2012, which significantly moderated the increase in federal revenue relative to the fiscal cliff scenario and postponed sequestration until March.
The burden of this increased taxation was distributed unequally across income groups. For those earning up to $400,000 a year ($450,000 for those filing joint tax returns), the biggest impact came from the expiration of the cut in Social Security payroll taxes. On the flip side, the so-called Bush-era tax cuts were made permanent for this income bracket, removing the uncertainty about their eventual expiration. In contrast, high-income earners saw significant increases in tax rates on their income, capital gains and dividends.
Comparing Historical Levels with Today's
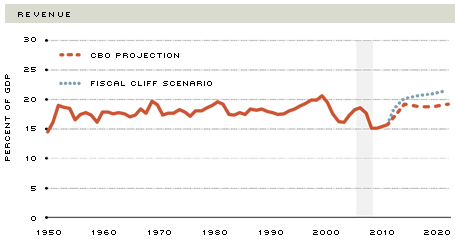
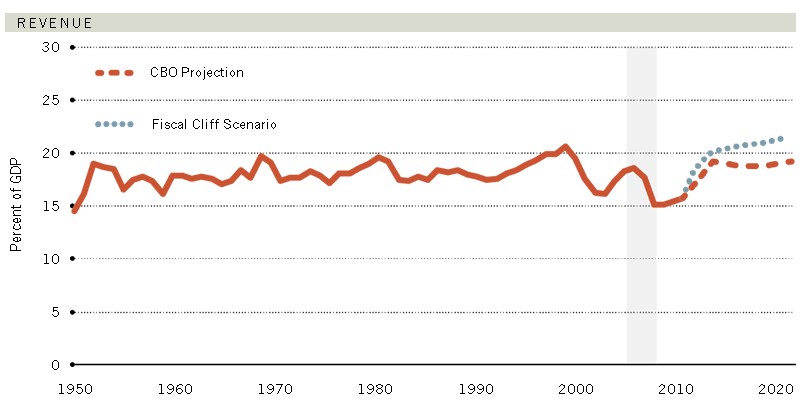
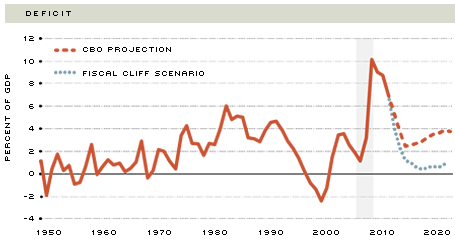
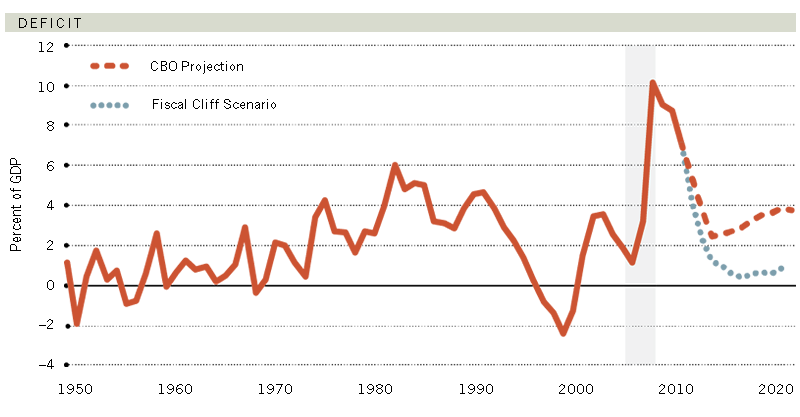
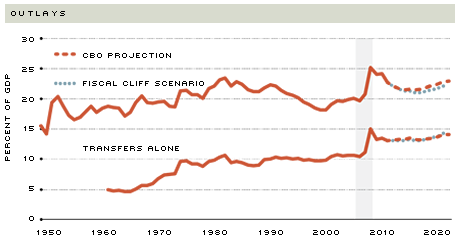
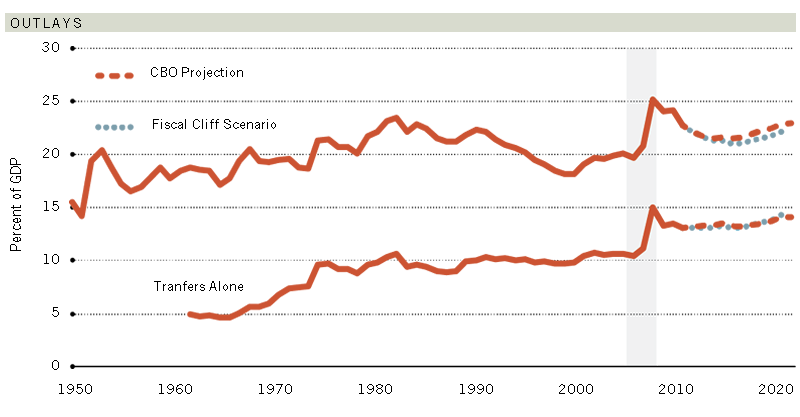
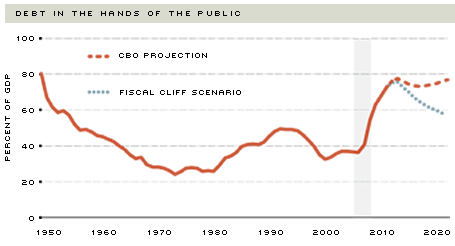
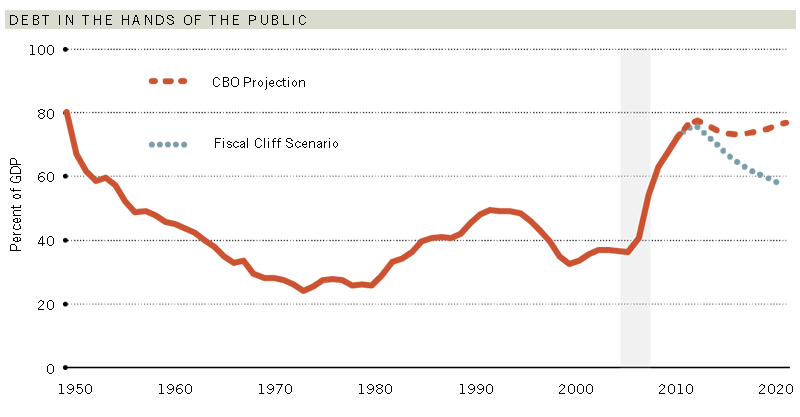
The accompanying chart shows the federal deficit, debt, revenue and outlays, all in terms of GDP, since 1950 and projected by the Congressional Budget Office (CBO) until 2023.1 As a reference, the chart also includes projections of what could have occurred if no fiscal deal had been reached—that is, if the fiscal cliff scenario had materialized.2
Until the recent financial crisis, federal revenue had been relatively stable, averaging about 18 percent of GDP between 1950 and 2008. A series of tax provisions (in 2001, 2003, 2009 and 2011-12) brought revenue down gradually to 16 percent of GDP in 2012. One of the main concerns during the fiscal cliff debate was the potentially recessionary effect of letting these tax provisions expire. The deal ended up being a compromise from a deficit-reduction perspective: Revenue is projected to return to historical levels, but it still will not be sufficient to finance current levels of spending.
On the expenditure side, federal outlays averaged 20 percent of GDP between 1950 and 2008. Since then, in response to the financial crisis and subsequent recession, outlays averaged 24 percent of GDP, peaking at 25 percent in 2009. Spending is currently at its highest since the end of World War II. The fiscal cliff deal postponed automatic spending cuts, which, although much dreaded in the news, would have had a minor impact on the federal deficit.
To better understand the outlook on spending, it is instructive to inspect changes in its composition. Since the end of the Korean War in 1953, defense spending has steadily decreased its share in total outlays. Currently, defense accounts for about 20 percent of all spending and is projected to decrease to about 13 percent in 2023. On the other hand, mandatory spending or "transfers"—mainly, retirement payments, medical care and unemployment assistance—is accounting for a larger share of spending. Remaining below 30 percent of total spending until 1970, the share of transfers has since exploded. In 2012, transfers accounted for about 57 percent of total outlays (13 percent of GDP) and are scheduled to continue growing. As the chart shows, much of the recent increase in transfers appears to be permanent; over the next decade, they are expected to remain about 3 percentage points of GDP above precrisis levels. This is an issue that will likely be at the center of any meaningful political negotiation aimed at curbing federal spending.
These recent developments in revenue and expenditure have resulted in large and persistent deficits since 2009. During the past four years, the deficit has been at its largest since World War II. One of the projected outcomes of the fiscal cliff scenario was a quick, if painful, resolution of the current deficit problem. Instead, the deal struck in January only raised projected revenue moderately and continued to push the spending issue forward unresolved.
Not a Pressing Problem Now, but…
Persistent deficits matter because they pile up debt. Mounting debt turns into a serious problem when markets start asking for heavy compensation to buy public bonds or flat-out refuse to roll over the maturing debt. At the moment, neither scenario appears pressing, as evidenced by the historically low yields earned by U.S. Treasury bonds. If anything, these low returns have postponed any sense of urgency in resolving fiscal matters. Looking ahead, however, as interest rates increase, so will the financial burden of accumulated debt. Eventually, this may require significant increases in taxes or reduction in other spending priorities, both of which have economic and political consequences.
Deficits and debt aside, the uncertainty about the ultimate size of government is itself an important concern. Will spending eventually return to its postwar average level of about a fifth of output, or will it remain permanently elevated due to the pressures of increased transfers? If government is to be larger, how is the burden of taxation going to be distributed? Here, it is important to know not only who will pay the tab, but also in what form new revenue is going to be collected. Income taxes? Capital gains and dividend taxes? Estate taxes? Uncertainty about future taxes, both level and type, makes undertaking marginally profitable endeavors more risky and, thus, generally depresses economic activity and outlook, further delaying the economic recovery.
Looking Back and Ahead
SOURCE: Congressional Budget Office and author's calculations.
NOTE: The shaded area highlights the period of the financial crisis and subsequent recession (2007-2009). Transfers are mainly retirement payments, medical care and unemployment assistance. Debt in the hands of the public excludes holdings by federal agencies.
Endnotes
- The deficit is the difference between outlays and revenue. Outlays include all forms of government spending (that is, purchases of goods and services, transfers to individuals and other grants, and interest payments on the debt). Debt is defined as "debt held by the public," which excludes holdings by federal agencies. All years referred to in this essay are fiscal years. The fiscal year in the United States begins Oct. 1 and ends Sept. 30 of the subsequent year and is designated by the year in which it ends. Before 1977, the fiscal year began July 1 and ended June 30. [back to text]
- This is the "baseline scenario" projected by the CBO in August 2012. [back to text]

Views expressed in Regional Economist are not necessarily those of the St. Louis Fed or Federal Reserve System.
For the latest insights from our economists and other St. Louis Fed experts, visit On the Economy and subscribe.
Email Us