


When Oil Prices Jump, Is Speculation To Blame?
Historically, the long-run primary driver of oil prices has been global demand.1 An expanding global economy demands more raw inputs, including oil, and that increased demand pushes up their price.
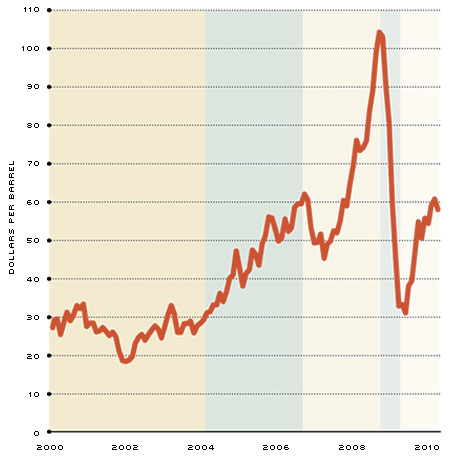
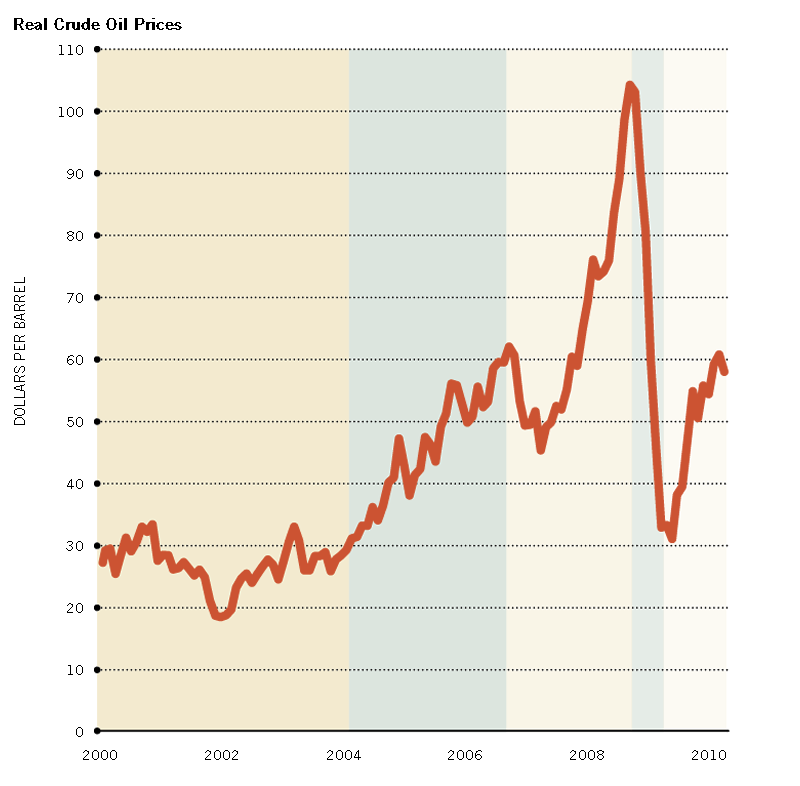
However, the past decade (2000-09) saw a rapid proliferation in the financialization of commodities, i.e., the creation and trading of financial instruments indexed to commodity prices. Estimates indicate that assets allocated to commodity index trading rose from $13 billion in 2004 to $260 billion in March 2008. Many people, including policymakers and economists, have posited that because this rapid and unprecedented growth in commodity index trading coincided with a boom in commodity prices, speculation by financial traders—and not supply and demand—drove the recent bubble in commodities.2 (See Figure 1.)
Real Crude Oil Prices
SOURCE: Energy Information Administration (EIA) and Bureau of Labor Statistics (BLS).
NOTES: Prices are deflated using CPI and expressed in year 2000 dollars. The different background colors delineate the periods over which we compute price changes in Figure 2.
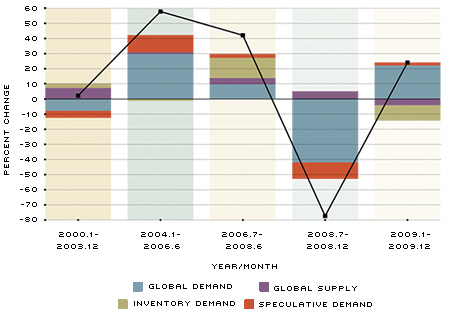
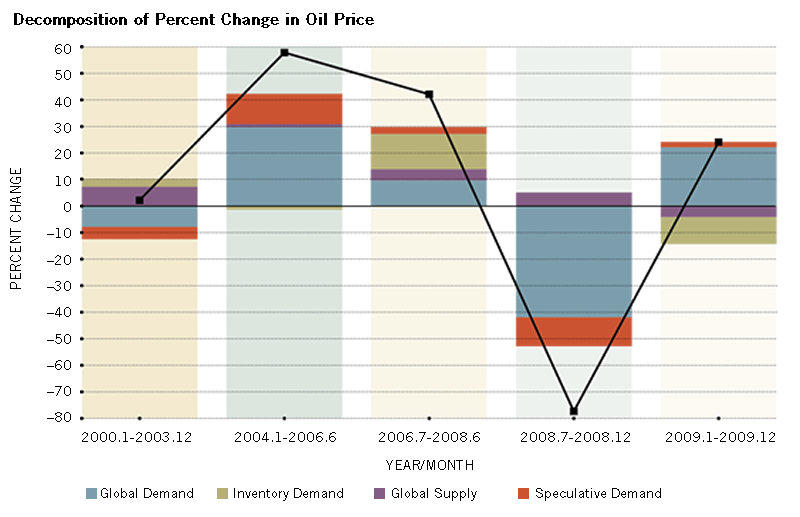
Decomposition of Percent Change in Oil Price
SOURCE: Authors' calculations. See Juvenal and Petrella.
NOTE: Square markers identify the total percent change in oil prices over the period identified on the x axis. Colored bars illustrate the percentage point contribution made by the four factors of interest. We identify periods by the beginning and end of distinctive trends. (See shading in Figure 1.)
Such charges are perhaps strongest in oil markets, where large investment banks, hedge funds and other investment funds have invested billions of dollars in oil futures contracts over the past decade. In our current research, we investigate these allegations.3 Specifically, we disentangle the contribution of four factors to oil price movements. Successfully identifying the true drivers of oil prices over the past decade is critical for efficient resource allocation and policy design.
First Contributor: Global Supply
Unanticipated changes in the availability of oil inversely affect the price of oil. For example, prices increase when the Organization of Petroleum Exporting Countries (OPEC) unexpectedly decides to cut oil production.
Second Contributor: Global Demand
A booming world economy demands more industrial commodities, and at the
top of that list is oil. For example, continuous growth in emerging countries such as China and India increases the aggregate world demand for oil and, consequently,
its price.
Third Contributor: Oil Inventory Demand
Expected future shortfalls in oil supply, relative to demand, motivate the storage of oil for future use. Either the possibility of a sudden shortage in production or of a new source of demand can create an expected shortfall. For example, uncertainty about future oil supply may arise from political instability in key oil-producing countries, such as Nigeria, Iraq, Venezuela, Libya or Iran. Such uncertainty increases demand for storing oil, driving up the current price.
Fourth Contributor: Speculation
Speculation is the act of purchasing something today with the anticipation of selling it at a higher price at a later date. Financial markets allow traders to speculate on oil prices in the following way: Traders buy a contract for oil to be delivered at a later date (a futures contract), sell the contract before the oil is due for delivery and use the proceeds to purchase another futures contract for delivery at a more distant date. Expectations that the price of oil will be higher in the future motivate investment funds to take positions in these contracts, and as demand for futures contracts increases, so does their price, which also moves the current oil price.
Decomposing Oil Prices in the Past Decade
Figure 2 illustrates the degree to which oil price trends over various parts of 2000-09 are attributed in our model to each of the four elements discussed above. We identify periods by the beginning and end of distinctive trends, rather than by evenly spaced time intervals, in order to best capture the net contribution each factor made to each trend. (See shading in Figure 1.) The black line shows the modeled percent change in real oil prices during each time period, and the bars illustrate the percentage point contribution made by each of the four elements.4 For example, factors related to global supply pushed modeled oil prices about seven percentage points higher between 2000 and 2004 than they would have been otherwise, while changes in global demand drove modeled oil prices about seven percentage points lower over the same span than they would have been otherwise.
During the past decade, just as historically, global demand was the primary driver of oil prices: The blue bars representing the contribution of global demand are the largest and show the greatest co-movement with the total change in oil prices. Moreover, the decline in the real price of oil in the second half of 2008 can be traced predominantly to the sharp reversal in worldwide demand that resulted from the financial crisis and ensuing global recession.
Figure 2 also reveals, however, that speculative demand did materially contribute to the increase in oil prices from 2004 to mid-2008. In particular, the contribution from speculation to rising oil prices (red bar) exceeded the combined contribution of global supply and inventory demand (purple and green bars) from 2004 to mid-2006. Overall, we estimate that speculation accounted for about 15 percent of the measured rise in oil prices from 2004 to mid-2008.
It is noteworthy that this trend began in 2004, which is when significant investment from index funds started to flow into commodities markets. Interestingly, speculation played a much smaller role during the second phase of rising prices, from mid-2006 through mid-2008, underscoring that gains from speculation decrease as current oil prices increase. Higher oil prices require that speculators allocate more investment funds upfront to purchase the same quantity of contracts, yielding a lower return as a percent of investment for the same dollar increase in oil prices.
But in the second half of 2008, just as in 2004 to mid-2006, speculation was again the second most-important factor driving oil prices: Only the blue and red bars can significantly explain the decline in oil prices, or "popping" of the bubble, during the second half of 2008. Just as the recession that was caused by the financial crisis decreased global demand for oil, the financial crisis also hurt the risk appetite of financial investors for risky commodities in their portfolios, consequently pushing prices down.5
Looking to the other factors, oil inventory demand played only a marginal role in the oil price buildup from 2004 to mid-2006 but accounted for a large share of the spike from mid-2006 to mid-2008. (Note that the green bar exceeds even the blue bar during the mid-2006 to mid-2008 period.) On the flip side, however, both oil inventory demand and global supply fail to explain much if any of the subsequent decline in oil prices in the second half of 2008. In total, oil supply contributed perhaps the least to both the boom and bust in oil prices, consistent with previous findings.
On balance, the evidence does not support the claim that a sudden explosion in commodity trading tectonically shifted historical precedent: Global demand remained the primary driver of oil prices from 2000 to 2009. That said, one cannot completely dismiss a role for speculation in the oil bubble of the past decade. Speculative demand can and did exacerbate the boom-bust cycle in commodity prices. Ultimately, however, fundamentals continue to account for the long-run trend in oil prices.
Endnotes
- See Kilian. [back to text]
- See Tang and Xiong. [back to text]
- See Juvenal and Petrella. [back to text]
- While the four components discussed can account for the large majority of oil price changes, the model that we estimate does not require, or assume, that all factors important to oil prices are included. The allowance for omitted factors explains why summing the four individual contributions may not always equal the total change. Also note that because we are interested in comparing relative trends and not levels, we make the normalization of indexing all factors to the same baseline level in 2000. [back to text]
- See Tang and Xiong. [back to text]
References
Juvenal, Luciana; and Petrella, Ivan. "Speculation in the Oil Market." Working Paper 2011-027B, Federal Reserve Bank of St. Louis, January 2012.
Kilian, Lutz. "Not All Oil Price Shocks Are Alike: Disentangling Demand and Supply Shocks in the Crude Oil Market." American Economic Review, 2009, Vol. 99, No. 3, pp. 1053-69.
Tang, Ke; and Xiong, Wei. "Index Investment and Financialization of Commodities." Working Paper, Princeton University, January 2011.
Views expressed in Regional Economist are not necessarily those of the St. Louis Fed or Federal Reserve System.
For the latest insights from our economists and other St. Louis Fed experts, visit On the Economy and subscribe.
Email Us