Earnings Growth Over a Lifetime: Not What It Used To Be
Many changes have occurred in the U.S. labor market since 1940. Examples include changes in the premium college graduates are paid over high school graduates, female participation in the labor force, executive compensation, immigration, etc.1 One aspect that has received little attention is the changes in the profile of earnings over the life cycle for people born in different decades.
Flatter Life-Cycle Profiles
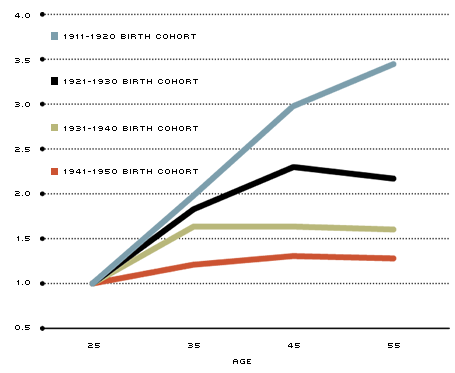
Figure 1 illustrates the earnings profile of high school-educated workers for four birth cohorts, those born in the 1910s, 1920s, 1930s and 1940s.2
Real Earnings over the Life Cycle for Workers with a High School Diploma

SOURCE: Census data 1940-2000, IPUMS USA. Steven Ruggles, J. Trent Alexander, Katie Genadek, Ronald Goeken, Matthew B. Schroeder, and Matthew Sobek. Integrated Public Use Microdata Series: Version 5.0 [Machine-readable database]. Minneapolis: University of Minnesota, 2010.
Real earnings are measured in year 2000 dollars. Synthetic cohorts are built from census data for white male workers with only a high school diploma. Each life-cycle profile is described by mean earnings of four age groups: 20-29, 30-39, 40-49 and 50-59. Earnings at each age for each cohort are normalized by earnings at age 20-29 for that cohort.
When individuals with only a high school diploma from the cohort born between 1911 and 1920 entered the labor force (age 20 to 29), their average earnings rose by a factor of 3.5 over the next 30 years of the working life span. In contrast, the profile for the cohort born between 1941 and 1950 is flatter: The rise in earnings for this cohort over the 30-year span is a factor of just 1.3.3 That is, the later cohort did not experience the same earnings growth over the life cycle as the earlier cohort did. Why did the life-cycle profile become flatter for the later cohorts?
A Theory of Earnings over the Life Cycle
To answer the question, it is useful to start with a theory of earnings over the life cycle. A model was developed by the economist Yoram Ben-Porath in 1967 to explain why a worker experiences earnings growth over the life cycle, rapidly while young but not so rapidly as he gets older. In this model, each individual (e.g., a high school graduate) enters the labor force with an innate ability. The ability of each worker includes both cognitive and noncognitive skills and describes the worker's capacity to learn and to accumulate human capital.4 The worker devotes some of his time to working, which yields current income, and the rest of his time to accumulate human capital, which yields higher future income.
At the early stage of the life cycle, the worker will allocate more time to accumulating human capital since he has almost all of his working life span ahead of him to recoup the investment. Toward the end of the working life span, the worker will slow down the accumulation of human capital. Such a pattern of human capital accumulation results in an earnings profile that is (i) rising with age when the worker is young and (ii) gradually tapering off as the worker gets older. Workers of different innate ability accumulate human capital at different rates: More-able workers accumulate human capital more rapidly while they are young and, hence, have steeper increases in their earnings.
Role of Ability
One possible explanation for the change in life-cycle profiles in Figure 1 is that the pool of high school-educated workers in the later cohort is different from the pool of high school-educated workers in the earlier cohort. Specifically, the explanation hinges on the ability of the average high school-educated worker in the earlier cohort being higher. Why would the average ability be different across cohorts? It is not because we have a strong reason to believe that the high school graduates of the earlier birth cohort had higher innate abilities than those of the later cohort. However, the pool of high school-educated workers in a cohort is determined by who among the high school graduates chooses to enter the labor force and who decides to go to college. Observations on the educational choice of different cohorts would then inform us on the change in average ability of high school-educated workers and help us explain the change in life-cycle profiles.5
To understand how ability plays a role in the changes in life-cycle profiles, imagine high school graduates with different innate abilities. The ability distribution in the earlier cohort, as mentioned in the previous paragraph, is the same as that in the later cohort. Graduates above a threshold level of ability decide to go to college, and graduates below the threshold decide to enter the labor force. College enrollment data on the fraction of high school graduates who continue their studies by going to college maps into the threshold ability: Increases in the fraction imply decreases in the threshold ability.
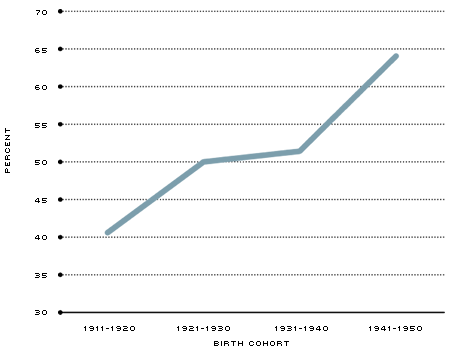
Figure 2 illustrates the steady rise in the percentage of high school graduates who have enrolled in college.
Percentage of High School Graduates Who Continued to College

SOURCE: Census data, 1940-2000, IPUMS USA. Steven Ruggles, J. Trent Alexander, Katie Genadek, Ronald Goeken, Matthew B. Schroeder, and Matthew Sobek. Integrated Public Use Microdata Series: Version 5.0 [Machine-readable database]. Minneapolis: University of Minnesota, 2010.
For each birth cohort, this percentage is at ages 30-39. Some college education and above includes any schooling past high school.
The fraction is 40 percent for the 1911-20 cohort and 64 percent for the 1941-50 cohort. That is, the threshold ability for the later cohort is lower; so, the average worker who enters the labor force right after high school has a lower ability. The lower ability then, according to the Ben-Porath model, implies that the human capital accumulation is less rapid. Hence, the life-cycle earnings profile of high school-educated workers in the later cohort is flatter.
Is there any direct evidence that the innate ability of the average high school-educated worker in the later cohort is lower? It is difficult to directly verify the decrease in average ability since measures that include both cognitive and noncognitive skills of workers of different cohorts are not easily available.
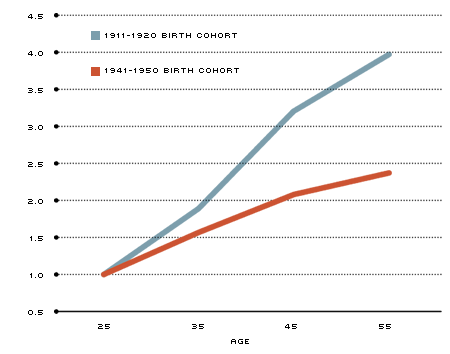
We can, however, indirectly verify the decrease in ability using the theoretical implications of the model. For example, just as the pool of high school-educated workers looks different across cohorts because of the educational choice, the pool of college-educated workers also looks different. If the ability of the average high school-educated worker is lower in the later cohort because of the lower threshold, then it must be the case that the ability of the average worker who continued his studies beyond high school is also lower in the later cohort. Then, the Ben-Porath model implies that the life-cycle earnings profile for a college-educated worker in the later cohort should be flatter relative to that of the earlier cohort. This implication of the model can be examined using data for workers who are not in Figure 1: data on life-cycle earnings profiles of workers who enrolled in college.6 For the cohort born between 1911 and 1920, the earnings of the college-educated worker increases by a factor of 4 over a working life span of 30 years; for the cohort born between 1941 and 1950, the corresponding increase is a factor of about 2.4. The life-cycle earnings profile of the college-educated worker in these two cohorts is illustrated in Figure 3.
Real Earnings over the Life Cycle for Workers Who Have At Least Some College Education

SOURCE: Census data 1940-2000, IPUMS USA. Steven Ruggles, J. Trent Alexander, Katie Genadek, Ronald Goeken, Matthew B. Schroeder, and Matthew Sobek. Integrated Public Use Microdata Series: Version 5.0 [Machine-readable database]. Minneapolis: University of Minnesota, 2010.
Real earnings are measured in year 2000 dollars. Synthetic cohorts are built from census data for white male workers who have some college education and above. Each life-cycle profile is described by mean earnings of four age groups: 20-29, 30-39, 40-49 and 50-59. Earnings at each age for each cohort are normalized by earnings at age 20-29 for that cohort.
Thus, it is indeed the case that the life-cycle earnings profile of the college-educated worker in the later cohort is also flatter, as implied by the Ben-Porath model. This indirect evidence is in favor of the explanation based on the educational choice of workers in different cohorts.
Endnotes
- See Ashenfelter and Card. [back to text]
- The details are in Kong. See also Kambourov and Manovskii. [back to text]
- Of course, at the time of entry into the labor force, the later cohort earned more than the earlier cohort due to sustained productivity growth in the U.S. For example, workers of age 20-29 from the later cohort earned 2.5 times more than similar workers in the earlier cohort. [back to text]
- Test scores that are designed, for instance, to evaluate knowledge in math or science are only part of the measure of ability in Ben-Porath's model. [back to text]
- The details of this explanation are worked out in Kong. [back to text]
- This is not the same as the data in Figure 1. Recall that all of the workers in Figure 1 have only a high school diploma and did not continue their studies past high school. [back to text]
References
Ashenfelter, Orley; and Card, David, eds., Handbook of Labor Economics, Vol. 1-4, Amsterdam, Holland: Elsevier. 1987, 1987, 1999 and 2012.
Ben-Porath, Yoram. "The Production of Human Capital and the Life Cycle of Earnings." Journal of Political Economy, August 1967, Vol. 75 No. 4, pp. 325-365.
Kambourov, Gueorgui; and Manovskii, Iourii. "Accounting for the Changing Life-Cycle Profile of Earnings." Unpublished manuscript, University of Toronto, October 2009.
Kong, Yu-Chien. "Ability and Education Choice: Accounting Quantitatively for the Flattening of Lifetime-Earnings Profile." Unpublished manuscript, University of Iowa, July 2011.
Views expressed in Regional Economist are not necessarily those of the St. Louis Fed or Federal Reserve System.
For the latest insights from our economists and other St. Louis Fed experts, visit On the Economy and subscribe.
Email Us


