


District Overview: Employment in Major Cities in the District Slumps Relative to the Rest of the Country
The most recent recession was deep and long, the longest recession since the Great Depression. Economic growth has been positive since the fourth quarter of 2009, but the labor market recovery remains slow. From the business cycle peak in December 2007 to the trough in June 2009, the U.S. economy lost over 7.5 million jobs, a decline of 5.4 percent of total employment.
Over the same period, the Eighth District lost 306,412 jobs (4.6 percent of total employment). In contrast, during the 2001 recession, the U.S. economy lost 1.6 million jobs (1.2 percent of total employment) and the District lost 107,547 jobs (1.6 percent of total employment).
The 2007-09 recession is very similar to the 2001 recession in one way. Each was followed by a "jobless recovery." In such recoveries, employment climbs back at a much slower rate than economic activity.
After each of the past five recessions ended, it took an average of 18 months after the trough for the employment level to reach its pre-recession level. The longest return to "full" employment, 39 months, followed the 2001 recession. Although this eight-month recession technically ended in November 2001, employment did not consistently increase until August 2003, the trough for employment after the recession. The nation's economy shed an additional 1.1 million jobs between November 2001 and August 2003. Similarly, over 600,000 jobs were lost between June 2009 and September 2010, which was the trough for employment after the latest recession.
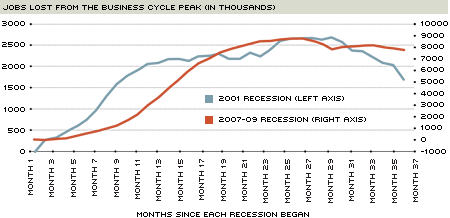
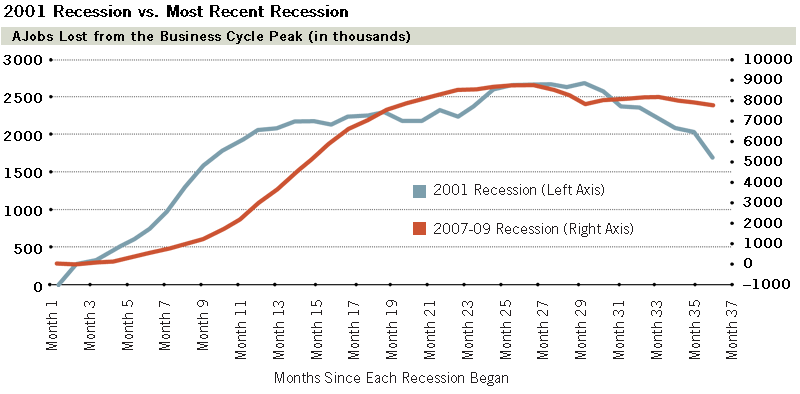
Figure 1 illustrates the number of jobs lost relative to the peak in each recession. By March 2004, three years after the 2001 recession started, the economy recovered 34 percent of its jobs. Three years after the most recent recession started, the economy recovered only 4.7 percent of its jobs.
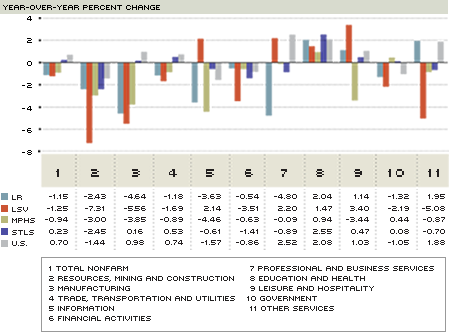
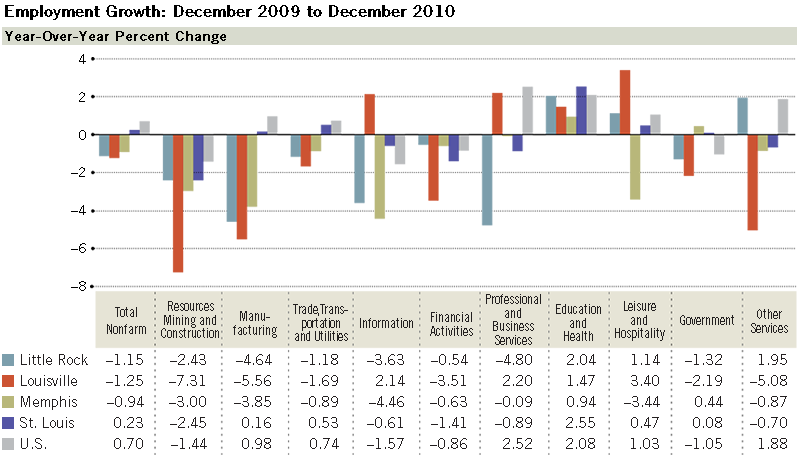
During the 2001 recession, the four major metropolitan statistical areas (MSAs) in the Eighth District—except for Memphis—outperformed the nation. During the 2008-09 recession, however, both Memphis and St. Louis fared worse than the U.S. In 2010, the U.S. performed markedly better in employment gains than the four major Eighth District MSAs—St. Louis, Little Rock, Louisville and Memphis. (See Figure 2.)
Little Rock Zone
During 2009, Little Rock had the best performance in terms of payroll employment among the four major Eighth District MSAs. However, in 2010, Little Rock fared poorly relative to its counterparts, with an employment decline of 1.2 percent. Only Louisville fared worse.
The decline in Little Rock's professional/business services sector was the greatest among the four MSAs, at 4.8 percent. The next greatest decline in this sector was
St. Louis' 0.9 percent. Other sectors in Little Rock that experienced large declines were manufacturing (–4.6 percent) and information (–3.6 percent). Sectors in Little Rock that experienced positive growth were education/health (2.0 percent), other services (2.0 percent) and leisure/hospitality (1.1 percent).
Louisville Zone
From December 2009 to December 2010, payroll employment in Louisville dropped 1.3 percent, the most severe drop among the four MSAs. Louisville experienced the greatest decline in six of the 10 sectors: resources/mining/construction (–7.3 percent), manufacturing (–5.6 percent), other services (–5.1 percent), financial activities (–3.5 percent), government (–2.2 percent), and trade/transportation/utilities (–1.7 percent). However, it had the greatest growth among the four major MSAs and the nation in leisure/hospitality (3.4 percent) and information (2.1 percent). The professional/business services sector in Louisville also experienced an employment growth of 2.2 percent, best among the four major MSAs but not as good as the nation as a whole (2.5 percent).
Other MSAs in the Louisville Zone had greater employment growth than Louisville.
Clarksville, on the Tennessee-Kentucky border, and Bowling Green, Ky., had a positive employment growth of 1.0 percent and 1.5 percent, respectively. Evansville, Ind., saw its payroll employment decline by 0.6 percent.
Memphis Zone
Within the last year, although eight out of 10 sectors in Memphis experienced declines in employment, Memphis' payroll employment declined a modest 0.9 percent, which was in the middle of the pack among the U.S. and the major MSAs in the Eighth District. Memphis employed a relatively large share of its workforce in sectors that had positive growth or relatively small declines. With 26.6 percent of the Memphis workforce in trade/transportation/utilities, the 0.9 percent employment decline in this sector helped to mitigate the larger declines in sectors with a smaller share of the workforce. For example, even though Memphis saw employment declines of 4.5 percent in information, 3.9 percent in manufacturing and 3.0 percent in resources/mining/construction, the employment in these sectors was only 1.1 percent, 7.4 percent and 3.5 percent of the workforce, respectively. Moreover, employment in the government sector and in the education/health sector grew 0.4 percent and 0.9 percent; these two sectors had the second-largest (15.0 percent) and the third-largest (14.0 percent) share of the workforce in Memphis.
St. Louis Zone
St. Louis is the District's largest MSA, and its labor market most closely resembles the national labor market. From December 2009 to December 2010, St. Louis experienced a positive employment growth of 0.2 percent while U.S. employment grew 0.7 percent. In both the St. Louis economy and the national economy, about 13 percent of employment was in goods-producing industries, and about 87 percent of employment was in service-producing industries.
In 2009, the four major MSAs and the U.S. all shed manufacturing jobs at about 10.0 percent. Last year, an entirely different picture was painted: While the other District MSAs continued to shed manufacturing jobs at a rate of about 4.5 percent, St. Louis' and the nation's manufacturing employment increased. The resources/mining/construction sector in St. Louis continued to shed jobs in 2010 and had the most severe job loss at 2.5 percent. Nevertheless, this rate is significantly less than the 2008-09 decline of 14.9 percent. Growing sectors in St. Louis last year included education/health (2.6 percent), leisure/hospitality (0.5 percent), trade/transportation/utilities (0.5 percent) and government (0.1 percent).
Among other MSAs in the St. Louis Zone, Jefferson City and Columbia saw employment grow by 0.5 percent and 0.3 percent, respectively. Springfield saw a decline of 0.7 percent. All three cities are in Missouri.
Conclusion
The most recent recession was followed by a much more severe employment decline than the 2001 recession in terms of jobs lost and recovery time. During 2010, the four largest MSAs of the Eighth District lagged behind the nation in employment growth.
St. Louis was the only major MSA experiencing positive employment growth. Louisville had the greatest decline in employment.
Employment growth varied markedly across different sectors. For instance, Louisville had an employment decline of 7.3 percent in resources/mining/construction from December 2009 to December 2010, while it had a 3.4 percent employment increase in leisure/hospitality. This huge gap in the employment growth rates across sectors may cause a skill mismatch between laid-off workers in one sector with job vacancies in other sectors. This skill mismatch and its relation to the slow recovery in employment have been of increasing concern to economists.
Views expressed in Regional Economist are not necessarily those of the St. Louis Fed or Federal Reserve System.
For the latest insights from our economists and other St. Louis Fed experts, visit On the Economy and subscribe.
Email Us