This Is Not Your Father's Recession ... or Is It?
Recessions are a common occurrence in any economy, part of the pattern of expansion and contraction known as the business cycle. For most Americans, the current recession is, by far, the worst recession in their adult lifetime. Not since 1981 has the economy contracted for more than a single year. Heightening economic insecurity, this particular recession is also associated with a financial crisis, as many news stories recall the turmoil of the Great Depression.
Although there is a strong correlation between financial crises and severe economic downturns, not all financial crises result in a depression or even a recession: The U.S. economy never slipped into recession after the 1987 financial crisis.
Every recession and financial crisis has certain characteristics in common; at the same time, each event is unique. Similarities across recessions are generally related to declines in employment, production and inflation. Financial crises tend to be associated with an increased demand for government-backed assets and a decline in demand for private assets—a feature known as “flight to quality.”
The unique characteristics of the current recession are a significant decline in home prices and the resulting financial crisis. Surprising to many, the recent declines in employment and income, so far, have been consistent with past recessions. One feature of the current environment that stands out as a stark departure from past financial crises—particularly compared with the Japanese financial crisis or with the Great Depression—is a proactive response by policymakers.
Comparing U.S. Recessions
Since 1978, economists and policymakers have accepted the judgment of the National Bureau of Economic Research (NBER) Business Cycle Dating Committee on the start and end of a recession, or business cycle turning points. The NBER is a nonprofit organization, and the committee consists of well-respected economists from around the country. This group defines a recession as “a significant decline in economic activity spread across the economy, lasting more than a few months.” The committee does not use the popular definition of a recession as two consecutive quarters of negative growth in real gross domestic product (real GDP). Because of this, dating of recessions is sometimes confusing. The committee dated the start of the current recession as December 2007, even though real GDP actually increased by an average annual rate of 1.9 percent during the first two quarters of 2008.
According to the committee, the U.S. economy has experienced six periods of recession during the past 40 years.1 On average, these past recessions have lasted 10.8 months. The longest recessions—beginning in November 1973 and July 1981—each lasted 16 months. The shortest recession—beginning in January 1980—lasted six months. Although the end of the current recession is unclear, some economists expect it to extend into mid-to-late 2009, a duration of about 18 to 24 months.
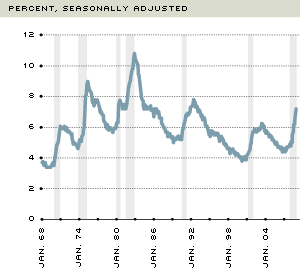
In its December 2007 report, the committee focused on four indicators: industrial production, total nonfarm employment, real personal income less transfer payments, and wholesale and retail sales. Many economists follow these indicators to gauge the state of the economy.2 Surprising to many noneconomists, the unemployment rate is not included. (See Figure 1) The rate tends to reach its minimum after the recession has begun. This occurs because the unemployment rate measures the share of the population not employed but actively seeking work. As the economy moves into recession, many people stop looking for work and are omitted from the index. Cushioning the unemployment rate’s decline, when the economy improves people will once again seek work.
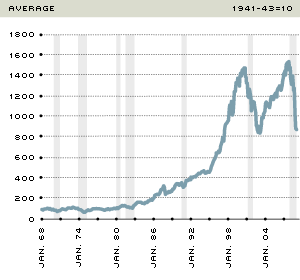
Three popular leading economic indicators that tend to move prior to business cycles are stock price indices, housing starts and interest rate spreads.3 In particular, stock price indices normally increase about three months prior to the end of a recession.
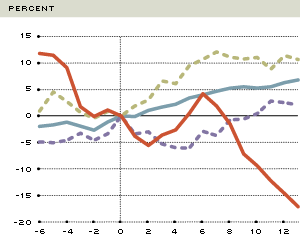
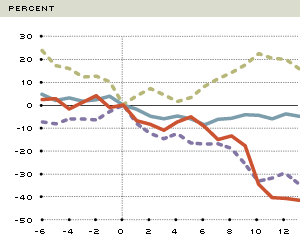
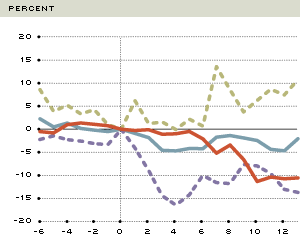
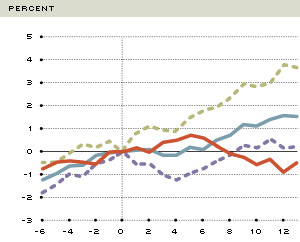
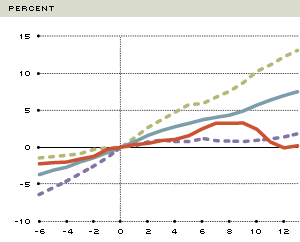
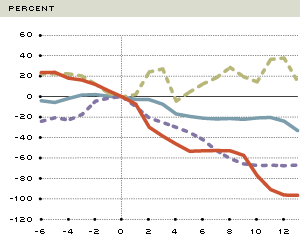
Figure 2 displays a broad collection of indicators used to assess the state of the economy. The series were selected because they exhibit trends generally unique to the current recession. Other important indicators have exhibited normal recessionary declines. The figure compares the declines throughout the current recession (red lines) to the average decline over the past six recessions (solid blue lines). Each series reports the percent change from the business cycle peak. The horizontal axis reports the months before and after the peak. For example, the datum on the red line at month one reports the percentage decline from December 2007 to January 2008, while the datum on the solid blue line at month one reports the average decline during the first month of the past six recessions. The variability in each series is captured by the two dashed lines, which report the highest and lowest values recorded across the past six recessions.
The two charts on the top row describe the general state of the economy through data on total nonfarm employment and real personal income less transfer payments. Percentage decreases in these series, thus far, have been within the range exhibited by past recessions. In December 2008 (month 12 on the chart), employment was 2.2 percent lower than a year ago, while real incomes declined by less than 1 percent. Although simple charts alone cannot suggest reasons for these declines, low inflation has likely assisted in stabilizing real incomes, and active monetary and fiscal policies have mitigated the spillover effects from turmoil in financial markets into these broad measures of economic well-being.
In the second row are two series that describe the current financial crisis: home prices, measured by the median sales price of existing family homes, and stock prices, measured by the S&P 500 index. The decrease in home prices started months before the current recession, dropping 12 percent in the six months before the recession and another 15 percent in the 12 months after the recession began. During past recessions, home prices tended to be relatively stable. Only during the 1990-1991 recession did home prices decline by more than 3 percent. Falling home prices erased over $3 trillion in home equity from the wealth of American households in 2008. The problems in the housing market have also taken a significant toll on equity prices, particularly the equities of financial institutions highly exposed to real-estate-related securities. Over the first 13 months of the recession, the S&P 500 lost over 40 percent of its value.
Trends in real consumption are reported in the third row of the figure. Consumption is separated into two components: consumption of durable goods and consumption of nondurable goods and services. Consumption of durable goods can be thought of as a type of household spending on “big ticket” items (e.g., refrigerators and automobiles), which are more likely dependent on financing. Consumption of nondurable goods and services tends to be smaller purchases that households buy with cash. The figure indicates that these two types of consumption have different cyclical properties. On the one hand, consumption of durables declined during past recessions; on the other hand, consumption of nondurables and services remained stable or even grew during past recessions. It is likely, because real incomes have remained stable, that recent declines in wealth and/or liquidity constraints have suppressed both forms of consumption. Consumption of durables declined 11 percent in the first 12 months of the recession. Consumption of nondurables and services, while remaining relatively stable, declined about 1 percent over the same time period.
Losses in wealth associated with home and stock prices have reduced consumer spending. Economic theory suggests that consumption is primarily driven by lifetime wealth. In response to short-term declines in income, households will smooth their consumption by borrowing. That means that consumption spending will fluctuate less over business cycles than household income or wealth will fluctuate. This theoretical result must be amended to account for liquidity constraints, that is, some households will find it difficult to borrow money as their income falls because lenders will be uncertain of future earnings and, hence, prospects for repayment. The current financial crisis has reportedly increased the difficulty of individuals and businesses to borrow. The result has been the largest recessionary decline in real consumption in the past 40 years.
The bottom row reports the trend in inflation, measured by the Consumer Price Index, and the trend in the effective federal funds rate. Slowing inflation has allowed the Federal Reserve to act in a proactive fashion when dealing with the current recession. Not only have reductions in the federal funds rate been larger than in past recessions, but the reductions actually started three months before the onset of the latest recession. The federal funds target decreased from 5.25 percent on Sept. 17, 2007, to 2 percent on April 30, 2008. By the spring of 2008, when the financial crisis was fairly certain, the Federal Reserve began to aggressively reduce its target, ultimately to between 0 and 0.25 percent on Dec. 16, 2008.
Comparing Financial Crises
Tightening of credit, declines in asset prices, and banking runs or failures tend to characterize financial crises.4 Tightening of credit occurs because banks, institutions and individuals fear that borrowers will be unable to repay a loan or investment. The inability of investors to evaluate the creditworthiness of borrowers causes them to move away from private assets (i.e., stocks or corporate bonds) and toward government-issued (or guaranteed) debt (i.e., Treasuries, bank deposits or currency). The shift from private to government-issued debt may reduce the demand for private assets, such as houses or equities, which, in turn, pushes down their prices.
Prior to the creation of the Federal Deposit Insurance Corp. (FDIC), bank runs were a feature of crises. Depositors who were worried about their ability to access cash that was held at their bank would run to the bank to withdraw their money. As depositors withdrew funds, banks would be forced to quickly liquidate assets, possibly at a loss, resulting at times in the failure of the bank.
In the current recession, bank runs at FDIC-insured institutions have not occurred. Worried investors, however, did withdraw large amounts from money market mutual funds after a major fund “broke the buck” in September 2008.5 In response, the Treasury and Federal Reserve instituted federal guarantees for all money market fund shares held as of Sept. 18, 2008. Similarly, some hedge funds have been forced to halt redemptions due to attempted runs.
Many have studied the Japanese financial crisis for lessons on how to handle the current U.S. financial crisis. The Japanese crisis, which lasted through the 1990s, is similar in many ways.6 In the decade preceding the crisis, deregulation allowed banks to transform their balance sheets, exposing them to more risk. Over this same period, the percentage of loans that banks extended to real estate doubled. During the financial crisis and subsequent recession, home prices in Japan declined over 35 percent and equity prices declined by roughly 60 percent. For many, the U.S. declines in home and equity prices are all too similar. (See Figure 2) The Japanese crisis was unique, on the other hand, because of its longevity (lasting over a decade), but with only modest declines in output (close to 1 percent) and low unemployment (under 5 percent).
Many economists have been quite critical of how Japanese policymakers handled the crisis. Economist Benjamin Friedman suggested in 2000 that the Japanese government incorrectly pursued a policy of forbearance, wherein weak supervision standards allowed banks to postpone the correct classification of nonperforming assets. Friedman also suggested that Japan should have applied more-expansionary monetary and fiscal policies. In response to the crisis, the Bank of Japan did, in fact, lower its key interest rate to virtually zero percent. Many have suggested, however, that the Bank of Japan could have gone further and was mistaken to assume that zero interest rates ended its ability to stimulate the economy through monetary policy.7 U.S. policymakers have learned from this experience and pursued expansionary policy even with target interest rates close to zero percent.
In a recent study, economists Carmen Rienhart and Kenneth Rogoff compare the recent declines in major economic indicators with the declines experienced during 15 previous financial crises associated with recessions in the U.S. and elsewhere.8 Three common features of the data are: (1) a collapse in asset prices, (2) profound declines in output and employment and (3) exploding government debt.
As expected, collapses in asset prices tend to be severe during financial crises. Reinhart and Rogoff report that, on average, real equity prices declined by 55.9 percent, while home prices declined by an average of 35.5 percent. The duration of these declines was particularly long: Equity declines lasted, on average, 3.4 years, and home prices slid for six years. While the durations are unknown, the declines reported in Figure 2 are generally consistent with these averages.
The reported declines in output and employment are smaller than decreases in asset prices. The average decline in real GDP per capita lasted just under two years, exhibiting a total decline of 9.3 percent, or an average quarterly decline of about 1 percent. In 2008, the average quarterly decline in real GDP per capita was 0.75 percent. At its highest, the unemployment rate across these countries averaged 7 percent, which is only about 1 percentage point above the 40-year average U.S. unemployment rate. A useful comparison is the Great Depression, during which the real GDP per capita declined by almost 30 percent and the unemployment rate increased to 23 percent. (See section on Great Depression comparison below.)
Exploding government debt is possibly the most astounding characteristic of financial crises. In the major post-WWII crises that Reinhart and Rogoff studied, the average increase in real government debt was 86 percent. The outlook for the U.S. national debt was ominous even before the current financial crisis, increasing roughly 60 percent between 2000 and 2007.9 Nevertheless, the debt had increased another 8.5 percent between January and September 2008. Reinhardt and Rogoff note that while antirecessionary government spending surely increases the national debt, the primary factor tends to be declining tax revenue from a slowing economy. This finding is possibly at odds with some criticism that government stimulus programs may raise the debt burden. Absent of its effect, government spending will increase the debt burden, but successful government stimulus programs could actually reduce the debt by growing the economy and, thus, increasing tax revenue.
Look Beyond the Headlines
Much of the fear surrounding the current recession has stemmed from the collapse in home prices and subsequent turmoil in financial markets. The “historic” undertone in the reporting of most economic data has heightened economic insecurity. As unique as the current recession may be, the policy response has been very proactive. So far, this has mitigated the impact of the financial crisis on broader measures of economic health. By understanding the parallels among recessions, it is possible to disentangle the typical recession-period bad news from the truly unexpected bad news that might signal unusual problems.
Figure 1
Leading, Lagging and Coincident Indicators
Business cycle indicators can be classified as leading, lagging or coincident based on their turning points relative to the business cycle. For example, the S&P 500 is a leading indicator because it generally turns down before the onset of a recession and up before the recession ends. (There are always exceptions.) While the unemployment rate is a lagging indicator, total employment is a coincident indicator—its peaks and troughs generally occur in the same month as business cycle peaks and troughs. The gray bars represent the current and past six recessions.
S&P 500 Stock Price Index
Civilian Unemployment Rate
Total Nonfarm Employment
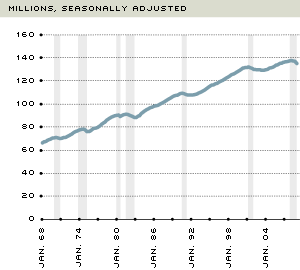
Figure 2
Comparison of Business Cycle Indicators
The current recession is different, but how different? The charts put things into perspective. The red lines represent the percent change in each series from the start of the current recession, December 2007. As a benchmark, the blue lines report the average (solid line), highest (gold dotted lines) and lowest levels (purple dotted lines) experienced over the past six recessions. (They do not represent data for a particular recession.) If the red line remains close to the average, or at least above the lowest, the decline can be interpreted as a normal recessionary one. The numbers on the horizontal axes represent months before and after the business cycle peak.
Employment

Real Income
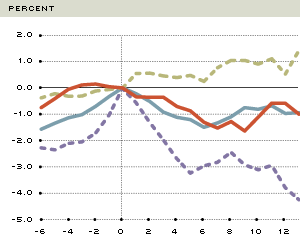
Median Home Price
S&P 500
Real Consumption: Durable Goods
Real Consumption: Nondurables and Services
Consumer Price Index
Federal Funds Rate
Endnotes
- According to the NBER, the past six recessions began in December 1969 (lasting 11 months), November 1973 (16), January 1980 (6), July 1981 (16), July 1990 (8) and March 2001 (8). [back to text]
- See the Federal Reserve Bank of St. Louis’ “Tracking the Recession” at http://research.stlouisfed.org/recession. [back to text]
- Interest rate spreads are the difference between a long-term interest rate (10-year Treasury bond) and a short-term interest rate (federal funds rate). Interest rate spreads have been negative before every recession in the past 40 years. [back to text]
- Tightening of credit is not necessarily unique to financial crises; it occurs during most, if not all, economic downturns. [back to text]
- “Breaking the buck” means that the fund’s asset value falls below $1 per share. [back to text]
- Freidman provides parallels between Japan’s financial crisis and the U.S. savings and loan crisis of the late 1980s and early 1990s. This section is based on Friedman’s interpretation of the Japanese experience and data reported in Reinhart and Rogoff. [back to text]
- Bernanke (2000) is often credited for this critique. [back to text]
- The crises are: Norway (1899), U.S. (1929), Spain (1977), Norway (1987), Finland (1991), Sweden (1991), Japan (1992), Hong Kong (1997), Indonesia (1997), South Korea (1997), Thailand (1997), Malaysia (1997), Philippines (1997), Colombia (1998) and Argentina (2001). [back to text]
- See Pakko for a complete discussion. [back to text]
- Depression-era failures are reported in Bernanke (1983). Current failures are reported in FDIC table BF01, total institutions in FDIC table CB01. [back to text]
- According to the NBER, the business cycle peak occurred in August 1929. Only annual data are available during this time period; 1929 is used as the recession start. The magnitudes of the declines are modestly increased when using the 1930 to 1931 percent change. [back to text]
References
Bernanke, Ben S. “Nonmonetary Effects of the Financial Crisis in the Propagation of the Great Depression,” American Economic Review, 1983, Vol. 73, No. 3, pp. 257-276.
Bernanke, Ben S. “Japanese Monetary Policy: A Case of Self-Induced Paralysis,” in Ryoichi Mikitani and Adam S. Posen eds., Japan’s Banking Crisis and Its Parallels to U.S. Experience, p.p 149-166. Washington: Institute for International Economics, 2000.
Friedman, Benjamin M. “Japan Now and the United States Then: Lessons from the Parallels,” in Ryoichi Mikitani and Adam S. Posen eds., Japan’s Banking Crisis and Its Parallels to U.S. Experience, pp. 37-56. Washington: Institute for International Economics, 2000.
Pakko, Michael. “Deficits, Debt and Looming Disaster.” The Regional Economist, January 2009, Vol. 17. No. 1, pp. 4-9.
Reinhart, Carmen M.; and Rogoff, Kenneth S. “The Aftermath of Financial Crises,” paper presented at the 2009 American Economic Association meetings. American Economic Review, forthcoming.
Views expressed in Regional Economist are not necessarily those of the St. Louis Fed or Federal Reserve System.
For the latest insights from our economists and other St. Louis Fed experts, visit On the Economy and subscribe.
Email Us


