


Now And Forever NAFTA
When the North American Free Trade Agreement (NAFTA) was being debated prior to its 1994 implementation, much was said and written about the potential consequences for U.S. exports. One noted doomsayer famously predicted that NAFTA would create a "giant sucking sound" as manufacturing jobs headed south to Mexico. Such doomsaying has since been proved wrong: A study by the U.S. International Trade Commission found that because of NAFTA, 13 U.S. industries increased their exports to Mexico, whereas none had reduced them. The study also found that because of NAFTA, 10 industries increased their exports to Canada, and eight industries reduced them.
Although most of the pre-NAFTA rancor was over the consequences of free trade with Mexico, its effects on U.S. trade with Canada were potentially far more significant. This is particularly true at the state level because Canada is the more important export destination for all but a handful of states. For example, in 1997 only the four states that border Mexico—Arizona, California, New Mexico and Texas—exported more manufactured goods to Mexico than to Canada. In contrast, 30 states had manufactured exports to Canada that were more than five times those to Mexico, and the United States as a whole exported more than twice as much to Canada. Also, manufactured exports to Mexico were highly concentrated, with Texas and California alone accounting for 61 percent of the U.S. 1997 total. It took nine states to account for 61 percent of manufactured exports to Canada.1
Because Mexico is a recent convert to free trade and has only recently begun liberalizing its internal markets, there might have been more room for exports to Mexico to expand. This is not to say that there was no room for exports to Canada to expand. Several studies have shown that, even after years of trade liberalization, the Canadian border is still a barrier to trade.2
Exports Booming Since NAFTA
Between 1993 and 1997, combined real U.S. manufactured exports to its NAFTA partners rose by 40 percent, with 34 percent and 54 percent increases to Canada and Mexico, respectively.3 Of course, such exports would have risen along with the countries' Gross Domestic Products (GDPs) anyway. Because of this, the more interesting numbers are the GDP-adjusted changes in exports, which subtract the effects of GDP growth.4
After this adjustment, the increase in U.S. exports to its NAFTA partners between 1993 and 1997 was still impressive: The GDP-adjusted increase in combined real U.S. exports to Canada and Mexico was 35 percent, with a 29 percent increase to Canada, and a 51 percent increase to Mexico.
North American Trade On the Rise
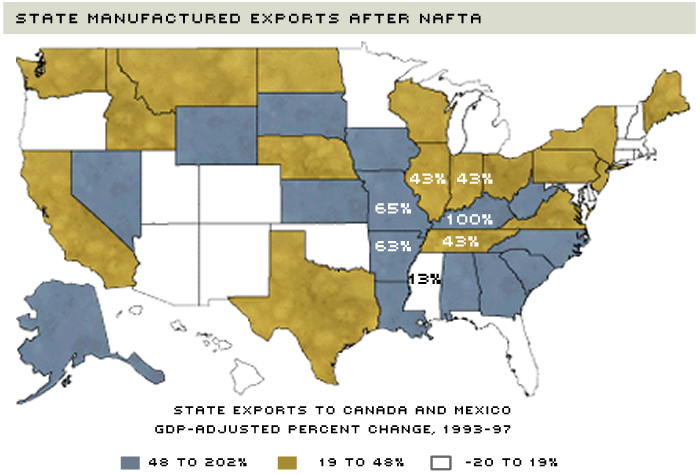
Between 1993 and 1997, combined real U.S. manufactured exports to Canada and Mexico, adjusted for increases in GDP, rose by 35 percent. State by state, however, the numbers varied a great deal. In the Eighth District, all states but Mississippi saw substantial increases in their exports to Canada and Mexico.
SOURCES: Massachusetts Institute for Social and Economic Research, Bureau of Economic Analysis
The map above illustrates the states' GDP-adjusted changes in combined real manufactured exports to Canada and Mexico, including the actual percent changes for the seven states of the Eighth District. (A complete list of the state-by-state results is shown in Table 1.) Fifteen states showed GDP-adjusted exports that rose by more than 48 percent. While they started from very low initial levels, the states with the biggest gains were Wyoming and Alaska, with increases of 202 and 201 percent. Alabama (111 percent) and Kentucky (100 percent) were the next biggest, with most of Alabama's change going to Mexico, and most of Kentucky's going to Canada.
Of the 18 states with the smallest changes in combined exports, five actually saw decreases: Maryland (–19 percent), Hawaii (–13 percent), New Mexico (–8 percent), New Hampshire (–4 percent) and Vermont (–2 percent). Regionally, all of New England except for Maine, and the southern Mountain States had GDP-adjusted exports that either had decreased or had increased very little.
Some states had somewhat anomalous changes in their export patterns: Delaware, Michigan and Colorado all saw large increases—greater than 75 percent—in their exports to Mexico. Moderate drops in exports to Canada meant that their combined exports increased relatively little. On the other hand, Washington and Nevada saw moderately large gains in combined exports, even though their exports to Mexico fell.
Eighth District Leading the Pack
Of the seven states in the Eighth District, all but Mississippi saw substantial increases in their combined manufactured exports to Canada and Mexico. Leading the way was Kentucky, which, as mentioned, had the fourth-largest increase of any state in the country. Kentucky's exports are strongly oriented toward Canada—its exports to Canada were almost 11 times its exports to Mexico—and its doubling of combined exports was driven by a 108 percent increase in exports to Canada. Even so, its 36 percent increase in exports to Mexico was still substantial.
Arkansas and Missouri saw very large increases in combined exports, with Arkansas' gain driven by a huge (165 percent) increase in exports to Mexico. Missouri's gain, on the other hand, largely reflected increased exports to Canada. Both states began and ended the period oriented toward Canada: In 1997, Arkansas exported nine times more to Canada than to Mexico, while Missouri exported five times more.
Illinois, Indiana and Tennessee saw substantial increases in combined exports, and all three were more oriented toward Canada than was the United States as a whole. In 1997, their exports to Canada were, respectively, six, 10 and four times their exports to Mexico. Export growth in all three states was fairly balanced, with similar percentage increases in exports to Canada and Mexico.
Although Mississippi experienced growth in exports to both countries, it found itself 13th from the bottom in terms of the combined change. Mississippi is much closer to Mexico geographically, but it tends to export more than four times as much to Canada.
Sucking Sound—What Sucking Sound?
It's safe to say that those who predicted that NAFTA would harm U.S. manufacturing exports have turned out to be spectacularly wrong. Far from the disaster scenario predicted by various pundits and doomsayers, U.S. manufactured exports to Mexico and Canada have boomed since the implementation of NAFTA. This export boom has been widely distributed geographically, with 46 states seeing increases in their GDP-adjusted manufacturing exports to Mexico and Canada. Every state in the Eighth District has been a part of the boom, with all but Mississippi seeing increases of more than 40 percent.
U.S. States' Exports to Canada and Mexico Since NAFTA
GDP-Corrected Percentage Changes, 1993-97
| To Canada | To Mexico | Total | |
|---|---|---|---|
| United States | 28.7% | 50.9% | 35.3% |
| Alabama | 53.7 | 336.9 | 110.8 |
| Alaska | 188.3 | 395.8 | 201.4 |
| Arizona | 68.9 | -10.5 | 5.8 |
| Arkansas | 40.8 | 165.0 | 62.7 |
| California | 29.9 | 66.2 | 46.2 |
| Colorado | -10.2 | 77.7 | 6.8 |
| Connecticut | 10.7 | 4.1 | 10.0 |
| Delaware | -15.3 | 109.1 | 2.7 |
| Dist. of Columbia | 41.3 | 23.2 | 38.3 |
| Florida | 7.4 | 0.5 | 5.3 |
| Georgia | 44.6 | 70.0 | 50.1 |
| Hawaii | -15.9 | 14.8 | -13.4 |
| Idaho | 48.8 | -27.5 | 35.2 |
| Illinois | 46.1 | 24.1 | 42.8 |
| Indiana | 42.7 | 33.9 | 42.6 |
| Iowa | 48.0 | 62.1 | 50.4 |
| Kansas | 66.5 | 28.8 | 55.6 |
| Kentucky | 107.9 | 36.1 | 99.7 |
| Louisiana | 92.3 | 56.7 | 72.9 |
| Maine | 47.3 | 8.7 | 46.4 |
| Maryland | -20.8 | -8.3 | -19.3 |
| Massachusetts | 14.2 | 30.3 | 16.4 |
| Michigan | -5.8 | 322.5 | 18.0 |
| Minnesota | 13.7 | -5.3 | 12.3 |
| Mississippi | 10.5 | 19.5 | 12.7 |
| Missouri | 72.0 | 35.4 | 65.3 |
| Montana | 34.4 | 47.8 | 36.1 |
| Nebraska | 41.7 | 65.2 | 47.6 |
| Nevada | 65.6 | -51.2 | 48.3 |
| New Hampshire | -10.9 | 58.9 | -4.2 |
| New Jersey | 34.1 | 54.1 | 37.8 |
| New Mexico | -11.8 | -4.0 | -7.7 |
| New York | 28.8 | 51.3 | 31.7 |
| North Carolina | 39.5 | 109.9 | 51.3 |
| North Dakota | 21.4 | 224.9 | 32.3 |
| Ohio | 35.2 | 24.8 | 35.0 |
| Oklahoma | 16.9 | -4.5 | 13.3 |
| Oregon | 9.1 | 8.7 | 9.7 |
| Pennsylvania | 37.0 | 47.1 | 39.0 |
| Rhode Island | 1.8 | 91.1 | 10.5 |
| South Carolina | 43.5 | 271.5 | 69.5 |
| South Dakota | 38.6 | 479.8 | 54.8 |
| Tennessee | 35.1 | 77.3 | 43.2 |
| Texas | 86.5 | 27.2 | 36.2 |
| Utah | 28.7 | 50.9 | 35.3 |
| Vermont | 8.7 | 47.7 | 14.2 |
| Virginia | -3.0 | 5.5 | -2.0 |
| Washington | 25.4 | 88.6 | 36.0 |
| West Virginia | 31.4 | -23.1 | 24.8 |
| Wisconsin | 67.6 | -5.3 | 59.7 |
| Wyoming | 25.9 | 49.2 | 29.0 |
Source: MISER and Bureau of Economic Analysis.
Endnotes
- These states were California, Illinois, Indiana, Michigan, New York, North Carolina, Ohio, Pennsylvania and Texas. [back to text]
- See Engel and Rogers (1996), McCallum (1995) and Wall (1999) for discussions of this. [back to text]
- Data on state manufactured exports are from the Census Bureau's Origin of Movement series, adjusted and distributed by the Massachusetts Institute for Social and Economic Research (MISER). [back to text]
- The changes in GDP for Canada and Mexico are measured in U.S. dollars at current market value. [back to text]
References
Engel, Charles, and John H. Rogers. "How Wide is the Border?" American Economic Review (December 1996), pp. 1112-25.
McCallum, John. "National Borders Matter: Canada-U.S. Regional Trade Patterns," American Economic Review (June 1995), pp. 615-23.
United States Trade Commission. "The Impact of the North American Free Trade Agreement on the U.S. Economy and Industries: A Three-Year Review." Investigation No. 332-81 (1997).
Wall, Howard J. "How Important is the U.S.-Canada Border?" International Economic Trends, Federal Reserve Bank of St. Louis (August 1999), p. 1.
Views expressed in Regional Economist are not necessarily those of the St. Louis Fed or Federal Reserve System.
For the latest insights from our economists and other St. Louis Fed experts, visit On the Economy and subscribe.
Email Us