


With Tailwinds Blowing, The District Economy Sails On
Last year, real gross domestic product (GDP) in this country grew at a 3.8 percent annual rate—the fastest since 1988. This rate is also faster than the nation's average GDP growth over the last five years (2.9 percent), 10 years (2.5 percent) and 20 years (2.7 percent). In addition to strong output growth, almost 2.75 million jobs were created last year in the United States, which is about 425,000 more than were created in 1996. The 2.75 million figure is also greater than the nation's average job growth over the past five, 10 and 20 years. On top of this, the nation's average unemployment rate in 1997 was 5 percent—the lowest since 1970. By all indications, the U.S. economy is performing exceptionally well seven years after the trough of the last recession.
The Eighth District economy has been faring equally well.1 The District's 1997 unemployment rate, for example, was 4.6 percent—the lowest ever recorded for the region. In addition, slightly more than 225,000 jobs (or roughly 8 percent of all jobs created nationwide) were created in the District's seven states last year. That said, job growth is actually down from the year before, and the year before that. This is not surprising, however, since sustained periods of low unemployment rates often lead to slowing job growth; when few people are available for work, firms can't fill vacancies.
Output from the District states has also been strong. Gross state product (GSP), like GDP, measures the dollar amount of the final goods and services produced in each state. Unlike GDP, though, GSP data are not released with the same frequency, or as timely. In fact, the most recent GSP data released were for 1994. Normally, GSP data have a two-year lag; this release, however, had a longer lag because the data were recalculated using chain weights, rather than the fixed weights that had been used before.2
District Output in a Nutshell
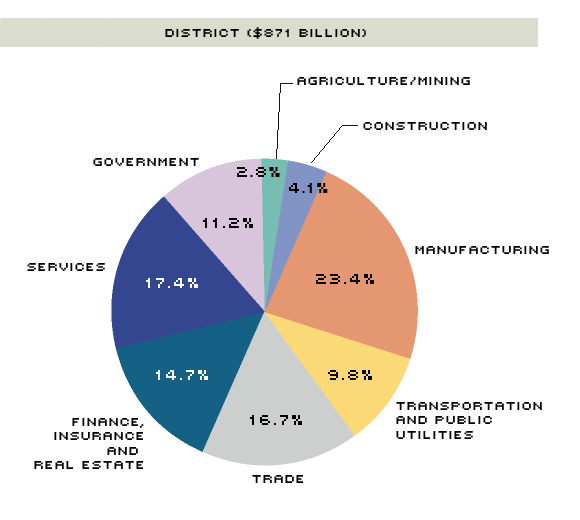
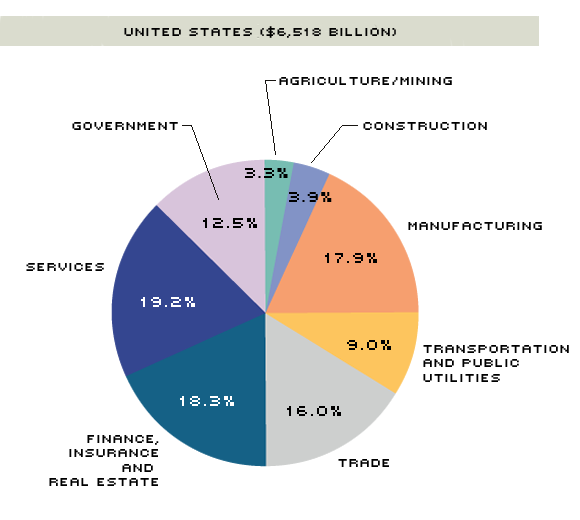
In 1994, the seven states of the Eighth District produced more than $871 billion in final goods and services. This amount represented almost 13.5 percent of all U.S. output. Sector by sector, though, the District has strengths and weaknesses. For example, goods produced at District manufacturing firms made up a relatively larger share of national manufacturing output (17.5 percent) than the District's overall contribution to national output (13.5 percent).
To illustrate the relative impact of District sector contributions to national output, a concentration ratio, which is the ratio between each sector's contribution and the District's total contribution, can be calculated.3 For example, because the District's contribution to national manufacturing output was about 30 percent greater than the District's entire contribution to total national output, the concentration ratio for manufacturing is 130.
The District's transportation and public utilities sector (TPU) followed manufacturing in its contribution to national output. District TPU firms made up about 14.5 percent of national TPU output. The concentration ratio for this industry shows that District firms contributed almost 9 percent more than the District's overall contribution to national output.
Two other District sectors—construction, and wholesale and retail trade—contributed relatively more than the District as a whole. Three of the four sectors (manufacturing, TPU, and wholesale and retail trade) held similarly strong positions in 1990, according to the last GSP data set examined in this publication.4
With concentration ratios of less than 100, the remaining District sectors—agriculture and mining, general services, government, and finance, insurance and real estate (FIRE)—contributed relatively less to national output than the District's overall contribution. District firms in the FIRE sector, for example, contributed the smallest relative amount to national output of any sector, making up only 11 percent of national FIRE output—about 20 percent less than the District's overall contribution.
A sector's share of national output, however, doesn't say much about that sector's importance to District output. For instance, although the region's FIRE sector made a relatively small contribution to the sector nationwide, the services provided by these firms were responsible for about 15 percent of District output (see chart). Only the manufacturing sector (at 23 percent), the general services sector (at 17.5 percent), and the trade sector (at 17 percent) contributed more. Thus, relative size in the nation is not necessarily a good indicator of relative size in the District. The agriculture and mining sector brings this point home. Although District agriculture and mining operations made up less than 3 percent of the total District economy, these same operations represented somewhat more than a tenth of the nation's total agriculture and mining output. Construction's influence was similar. It made up only 4 percent of the District's economy, although the sector represented about 14 percent of the nation's construction output.
District Growth Leads the Way
Examining the District's contributions and composition, however, provides only a snapshot of the economy in 1994. How did it behave getting there? Actually, rather well. District real output growth outpaced national output growth every year from 1990 to 1994. In 1994 alone, District output grew at a 5.7 percent rate, while the sum of all states' GSP figures (called national GSP) grew 4.2 percent.5
In fact, one could argue that the District led the rest of the country out of the recession earlier in the decade. In 1991, when the nation had just begun to recover from the economic downturn, the District states increased output 0.4 percent. Although not exactly overwhelming growth, it is noteworthy when compared with the nation's 1991 performance—a decline of 0.6 percent. The following year, 1992, was the watershed year, though. The District economy took off, logging 4.3 percent real growth, with the national economy trailing behind at 2.4 percent real growth. This District growth spurt, coupled with further gains in the following years, helped push the region's share of the national economy up more than half a percentage point—to about 13.5 percent—between 1990 and 1994.
But Does Past Growth Predict Future Growth?
Because GSP data are available only through 1994, they can't help evaluate the current state of the District economy. As noted earlier, recent employment growth in the District hasn't been as strong as in the rest of the nation. In fact, not only have District payroll employment growth rates been getting smaller since their peak in 1994, they also have continued to hover below national growth rates. In 1994, for instance, District employment grew 3.3 percent, while U.S. employment grew 3.1 percent. By 1997, District employment growth had slowed to 1.3 percent, while national growth had waned to just 2.3 percent. One might be led to believe, therefore, that this dramatic slowdown in District employment growth bodes poorly for the region's economy, particularly in its importance to the national economy.
As in most economic analyses, however, there is another hand to consider. While employment growth rates have been slowing in the nation and the District, unemployment rates have been falling, which is generally a sign of economic strength. In 1992, when the District unemployment rate peaked at 7 percent, the national unemployment rate peaked at 7.5 percent. By 1997, these rates had fallen to 4.6 percent in the District and 5 percent in the nation, leading one to conclude that the District continues to outperform the nation.
Which view is correct? In all likelihood, both are. Slowing employment growth probably implies that the District economy will not be able to maintain its current pace of output growth indefinitely, as fewer and fewer workers are available for newly created jobs. Eventually, the output growth rate will be forced to slow as the economy reaches capacity. And shrinking employment growth is one indication that it is approaching—or may have already surpassed—capacity. Falling unemployment rates are another indication of nearing capacity. Thus, both views reflect a strong District economy, with some moderate slowing likely in the offing. And a moderate slowing is not necessarily bad since it would give the economy a chance to catch a second wind and reallocate resources, clearing the way for even more growth in the future.
Endnotes
- In this article, District figures include state-level data for Arkansas, Illinois, Indiana, Kentucky, Mississippi, Missouri and Tennessee. [back to text]
- Chain weights attempt to overcome the problem of relative price changes in goods by using a weighting of prices from the previous two years to calculate the dollar value of goods. Fixed weights, on the other hand, use a single price from a designated base year to calculate the dollar value of goods. For a more detailed description, see Kliesen (1996). [back to text]
- The ratio is calculated by dividing the District sector share by the national sector share and multiplying the result by 100. [back to text]
- See Kliesen (1994) for an overview of the 1990 GSP data. [back to text]
- National GSP differs from GDP in that the former is the sum of the individual states' GSP figures, while the latter is a national figure only. Real GDP grew 3.5 percent in 1994.[back to text]
References
Kliesen, Kevin L. "Chained, Rested and Ready: The New and Improved GDP," The Regional Economist, Federal Reserve Bank of St. Louis (January 1996), pp. 10-11.
__________. "District Economic Update: Will the Sailing Remain Smooth?" The Regional Economist, Federal Reserve Bank of St. Louis (October 1994), pp. 12-13.
Views expressed in Regional Economist are not necessarily those of the St. Louis Fed or Federal Reserve System.
For the latest insights from our economists and other St. Louis Fed experts, visit On the Economy and subscribe.
Email Us