


Home Sweet Home in the Eighth District
Any way you slice it, the last two years have been good ones for residential construction and home sales in both the Eighth Federal Reserve District and the nation. Buoyed by a growing economy and the lowest long-term interest rates since the Johnson Administration, single-family building starts topped 1.29 million in the United States in 1993, the highest level in four years. And 1993 was nearly a record year for existing single-family home sales: The National Association of Realtors reports the sale of 3.8 million units, a 7.9 percent jump from 1992 and the highest level since 1979. In the District, all four major metropolitan areas—Little Rock, Louisville, Memphis and St. Louis—recorded increases in single-family building permits and single-family home sales in the last two years.
Rates Head South
Declines in long-term interest rates deserve much of the credit for the rebound in housing. Since peaking at about 10.75 percent in mid-1990—just before the onset of the 1990-91 recession—the monthly average rate on an FHA 30-year, fixed-rate mortgage has declined more than 3 percentage points. There were some periods in the fall of 1993 when it even fell below 7 percent, a level not seen since the late 1960s. And one-year adjustable rate mortgages tied to the one-year Treasury bill have dipped as low as 3.24 percent in the last year.
Falling interest rates typically stimulate the demand for housing and household goods. When rates drop significantly, homeowners can refinance their existing mortgages, either lowering their monthly payments, mortgage terms or both, freeing up financial resources for other uses. Homeowners also have an incentive to trade up, selling their current home and purchasing a more expensive one.
For first-time homebuyers, declining rates can shift the calculus from renting to buying. Even a small decline in interest rates can have a substantial impact on housing affordability. At 7 percent, a 30-year $100,000 mortgage commands a monthly payment of $665.30 compared with $804.62 on the same mortgage at 9 percent. The monthly payment is further reduced by the effects of the federal tax deduction for mortgage interest paid; for many families this "effective" monthly payment is less than rent. Combine the interest rate and tax effects with rising employment and rising median incomes and the result is increased housing demand and increased affordability.
As Housing Goes...
Housing has long been considered an important barometer of economic health. New construction makes a direct contribution to the nation's total output, or gross domestic product (GDP), as does the production of furniture, appliances and other household goods that depend on the health of the housing sector.
Interestingly, construction and its related industries are important components of GDP and important indicators of the economy's strength. Homebuilding and homebuying tend to be strongest when the economy is expanding and long-term interest rates are low. Because a house represents for most people their single largest liability (or asset when the mortgage is paid off), the decision to purchase a house is closely related to job security and other measures of financial security and wealth.
Location, Location, Location
While the entire country has benefited from the decline in long-term interest rates, not all housing markets have performed equally well. Regional differences in housing demand and supply are primarily the result of differences in local economic conditions. In the most recent economic cycle, the middle of the country has fared much better than either of the coasts, and that difference is reflected in housing affordability and construction activity.
According to recent data analyzed by the National Association of Home Builders (NAHB), the midwestern and southern portions of the United States—which the Eighth District straddles—are home to the nation's most affordable housing markets. The NAHB computes a quarterly housing affordability index—dubbed the Housing Opportunity Index (HOI)—to assess trends in homebuying potential in approximately 200 metropolitan areas. The HOI measures the ability of a typical family to purchase a home in its own market by comparing median family income with the median home price, at prevailing interest rates. For the nation as a whole, the HOI was 65.1 in the third quarter of 1993: U.S. households earning the median income of $39,700 could afford to purchase just over 65 percent of the homes offered for sale that quarter.1
Housing Affordability in the Eighth District
3rd Quarter 1993
| National Rank | Metro Area | HOI* | Median Income | Median Price |
|---|---|---|---|---|
| 63 | Columbia, MO | 83.8 | $39,100 | $86,000 |
| 87 | Fayetteville-Springdale, AR | 80.4 | 32,500 | 75,000 |
| 88 | St. Louis, MO-IL | 79.9 | 43,700 | 100,000 |
| 109 | Louisville, KY-IN | 77.0 | 36,500 | 79,000 |
| 127 | Little Rock-North Little Rock, AR | 74.1 | 36,400 | 91,000 |
| 149 | Memphis, TN-AR-MS | 68.7 | 35,300 | 100,000 |
| United States | 65.1 | 39,700 | 110,000 |
*Housing Opportunity Index
SOURCE: National Association of Home Builders
The table shows the indexes for the six District metropolitan areas included in the NAHB's survey. All six recorded HOIs that exceeded the national average. In Columbia, Missouri, the District's most affordable market, 83.8 percent of all households earning the area's median income of $39,100 could afford a house at the area's median price of $86,000. According to the NAHB, Memphis, while still above the national average, was the least affordable of the six cities with an HOI of 68.7. Though the median home price in Memphis equaled that of St. Louis ($100,000), a higher median income in St. Louis ($43,700 vs. $35,300) accounts for the large difference in affordability between the two areas.
The pace of economic activity helps explain not only the rebound in District housing markets, but also their relative strength. Most areas of the District were hit less hard during the most recent recession than the rest of the nation, with smaller declines in employment and other measures of economic activity, including housing permits. For example, while U.S. payroll employment declined at an annual rate of 1.8 percent during the recession, District payroll employment declined at a 1.2 percent annual rate.2 Since the recession, employment growth in the District has generally exceeded the national average. The close relationship between local economic growth and local construction activity is illustrated in the chart. Looking at the District's four major metropolitan areas, a clear pattern emerges: the trend in single-family permits issued tracks very closely the trend in area economic growth (proxied by employment growth).3 For example, in the last five years, all four metro areas experienced their greatest improvement in single-family permit issuance in the same year (1992) in which payroll employment grew the most.
A Healthy Economy is the Key to Housing
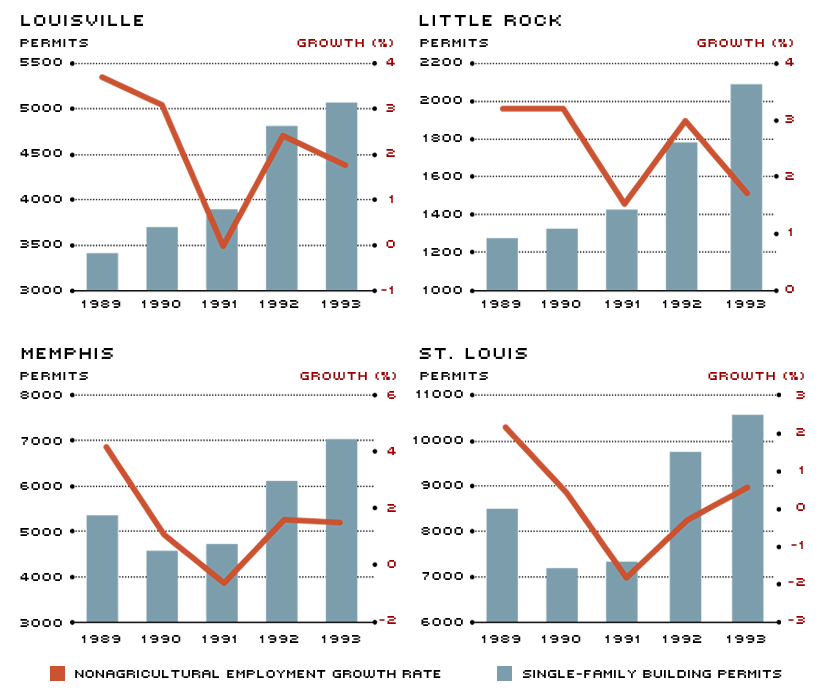
SOURCE: U.S. Bureau of the Census and state employment offices
What's Ahead?
Most analysts expect 1994 to be another good year for new single-family home construction and sales nationwide. In the District, poor weather in 1993 created a backlog for builders, which should sustain much of the past year's momentum well into 1994. But the outlook is not all rosy, as rising long-term interest rates and increased materials costs (especially lumber) threaten to price some potential buyers out of the market. As long as interest rates and new home prices pick up only modestly, however, "there's no place like home" should continue to ring true across the district.
Endnotes
- According to the mortgage underwriting standards used for calculating this index, a family could afford to purchase a home equal to 3.5 times its annual income at the prevailing mortgage interest rate, assuming a down payment of 10 percent. The interest rate used in this index was 7.04 percent for the third quarter of 1993, an average for all fixed and conventional mortgages closed as reported by the Federal Housing Finance Board. [back to text]
- For more detailed analysis, see Kevin L. Kliesen, "Some Upbeat Trends in District Employment," The Regional Economist, April 1993. [back to text]
- Permit data are annual levels. Employment growth rates are calculated as compounded annual average growth rates. [back to text]

Views expressed in Regional Economist are not necessarily those of the St. Louis Fed or Federal Reserve System.
For the latest insights from our economists and other St. Louis Fed experts, visit On the Economy and subscribe.
Email Us