


Some Upbeat Trends in District Employment
Though it might have seemed otherwise to some, the Eighth Federal Reserve District escaped the brunt of the recent recession. For instance, the trend rate of growth in District payroll employment, while declining at a 1.3 percent annual rate during the recession, did so at slightly more than half the annual U.S. rate of 2.2 percent.1 (The recession began in July 1990 and ended in March 1991, according to the National Bureau of Economic Research.)
This article examines these trends in employment more closely for both the District and the United States. Specifically, what are some of the underlying employment trends that allowed our District to outperform the nation?
Moreover, how are individual District states and metropolitan areas fairing?2
Background
Much of the recent concern about employment among policymakers stems from the lack of job growth that normally accompanies an economic expansion. Unlike the four quarters immediately following previous post-World War II recessions, during which an average of 2.2 million jobs were created, employment growth during the recent recovery has been tepid (see chart). The lack of employment growth has occurred even though real gross domestic product (GDP) has grown at a 2.3 percent annual rate since the first quarter of 1991 and at a 4.1 percent annual rate for the second half of 1992.3
U.S. and Eighth District Payroll Employment
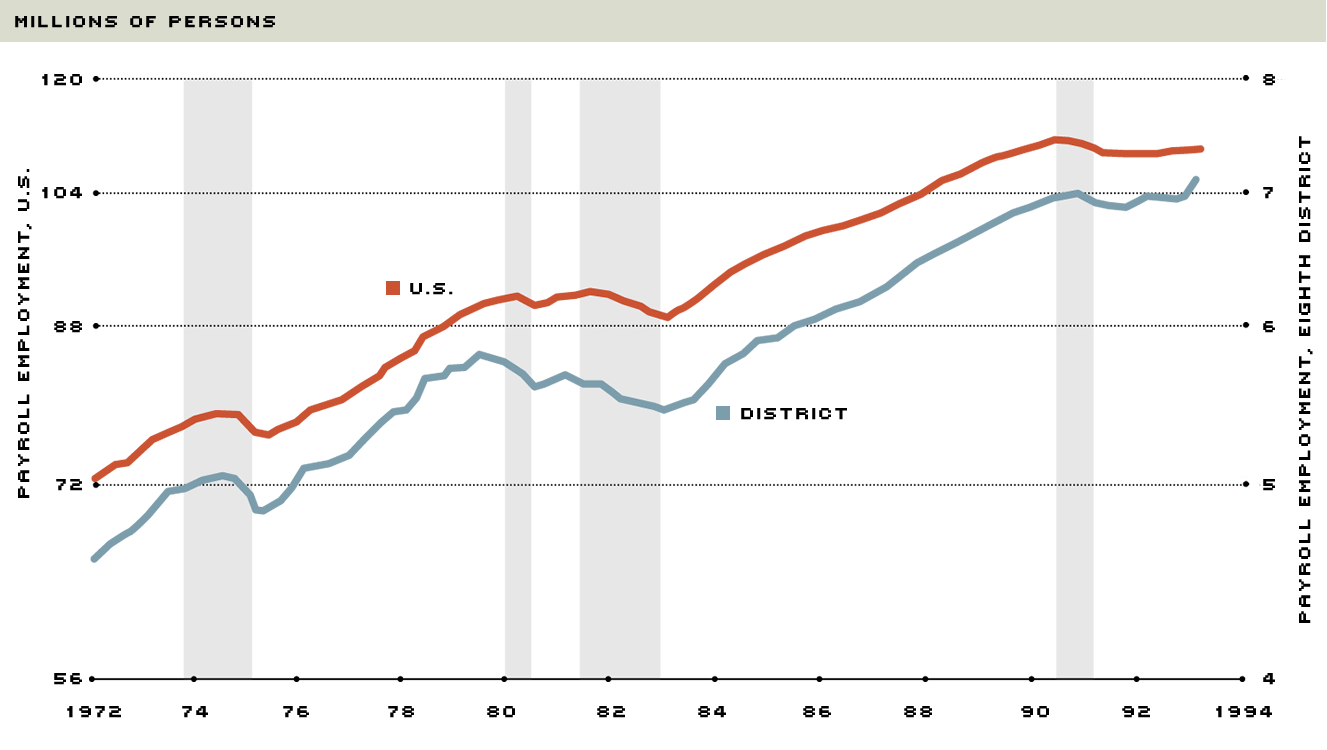
Ratio scale, seasonally adjusted 3-month moving average.
Vertical shaded areas represent periods of business recession.
Since the official end of the recession, U.S. nonagricultural payroll employment has grown at an annual rate of 0.1 percent; in contrast, District payroll emplyment has grown at an annual rate of 1.2 percent.
One useful way to view employment trends is to divide nonagricultural payroll employment into employment in goods-producing industries, such as auto manufacturers and apparel firms, and service-producing industries, such as health care and transportation firms. Typically, employment in goods-producing industries not only tends to be more cyclical—that is, it declines more in recessions and rises more in expansions—but it also rises much earlier and faster after the recession than does service-producing employment. Another important trend to note is that goods-producing employment, the bulk of which consists of manufacturing jobs, has grown very little over the past 25 years. In fact, manufacturing employment as a percent of total employment has steadily declined in the postwar period. Service-sector employment, on the other hand, has risen inexorably over time, currently accounting for about 79 percent of total nonagricultural payroll employment. Although some attribute this development to an underlying structural weakness in the U.S. economy, the growth in service-sector employment primarily reflects productivity gains in the manufacturing sector that have allowed the same amount of output to be produced with fewer workers.
The Recent Experience
How do these historical trends square with the pattern of job growth during and after the recent recession? District service-sector employment did not decline during the recession—in fact, it rose at a 0.2 percent annual rate. Moreover, it continues to rise, increasing at a 1.6 percent annual rate since March 1991. District goods-producing employment, on the other hand, after declining at a 5.6 percent annual rate during the recession, has rebounded slightly, rising at a 0.3 percent annual rate. A similar story emerges for the United States. During the recession, goods-producing employment declined at a 6 percent annual rate while service-producing employment fell at a much less rapid 1.1 percent annual rate. Since March 1991, the growth rate of goods-producing employment has continued to decline, falling at a 1.8 percent annual rate; the growth rate of service-producing employment, however, has risen at a 0.6 percent annual rate.
Clearly the combination of the continued weakness in goods-producing employment and lethargic job growth in service-producing industries has translated into weak overall employment growth for both the District and the United States. Many economists attribute this anemic growth to the restructuring that is affecting many sectors of the economy—for example, the downsizing in the defense industry and the attempt by manufacturers to boost productivity. Restructuring has also occurred in certain parts of the service sector; retailing and financial services come readily to mind.
Some of these factors have naturally affected employment trends in the Eighth District. By the same token, certain areas and industries in the District have prospered despite these unfavorable trends. To facilitate this analysis, let us divide the District into four zones.
Arkansas
Of the four areas we examine, the state of Arkansas was the only one to record increases in payroll employment during the recent recession (up at a 0.9 percent annual rate). Since the end of the recession, payroll employment in Arkansas has grown at a 2.8 percent annual rate, exceeding Kentucky's 2.3 percent rate of increase (the next highest). According to the University of Arkansas at Little Rock, the Arkansas economy has been bolstered in recent years by strong growth in exports, which have risen at double-digit annual rates since 1990. Elsewhere, the presence of firms such as Wal-Mart and Tyson Foods has helped northwest Arkansas prosper in recent years, while the northeastern part of the state has been able to attract several steel processing firms.
Kentucky/Southern Indiana
A second source of strength in the District recently has been the performance of the Kentucky economy, where payroll employment has risen at a 2.3 percent annual rate since March 1991. Louisville's economy, on the other hand, although well diversified, has weakened recently. For example, Louisville's payroll employment rose 2.7 percent from March 1991 to March 1992; it has subsequently risen at a 0.1 percent rate (through February 1993), however. Other areas of Kentucky and Southern Indiana have prospered. For instance, Bowling Green has recently attracted two major paper products manufacturers. Similarly, economic growth in the Evansville, Indiana, area has been relatively strong, reflecting gains in residential and nonresidential construction and the recent refurbishing of the Whirlpool plant there, which is expected to increase its production and employment levels this year.
Missouri
Of our four areas, Missouri employment growth was certainly the weakest both during the recession (decreasing at a 2.6 percent rate) and since the recession ended (rising at a 0.6 percent rate). Much of this weakness can be attributed to the St. Louis economy, which has been adversely affected by the downsizing in the military. For instance, as home to the nation's largest defense contractor, McDonnell Douglas, manufacturing employment in the St. Louis metropolitan statistical area (MSA) has declined by about 20,000 since the end of 1990. Many of these workers, however, have either found employment in other industries or relocated to other areas. Nevertheless, the unemployment rate in the St. Louis MSA currently stands at about 6.5 percent—down moderately from the 7.2 peak reached in June 1992.
Tennessee/Northern Mississippi
Compared with the U.S. economy, the Memphis economy has done rather well recently. Real retail sales in December 1992 were up 31 percent from the previous year, and the area's unemployment rate is currently 5.5 percent. Total payroll employment has risen at a 7.9 percent rate since September 1992; however, it has risen at only a 1.0 percent rate since March 1991. Because of the Memphis economy's important service sector component, it can sometimes weather the business cycle better than, say, a manufacturing-based economy. One should be careful, though, not to always make this assumption. For instance, Mississippi is the most manufacturing-intensive state in the Southeast, but its unemployment rate is currently 6 percent, down from 8.1 percent in January 1992. Moreover, from 1989 to 1991, per capita disposable income in Mississippi grew at 6.1 percent annual rate, one of the highest rates of increase in the nation and far out distancing the 4.3 percent rate of growth for the United States.
Although a measurable degree of uncertainty remains in some areas, the resumption of U.S. economic growth above its long-run potential is reassuring. Thus as the U.S. economy continues to improve and as its short-term structural adjustments diminish in importance, there will likely be a sustained rise in overall employment in most regions of the country.
Endnotes
- Unless noted otherwise, all growth rates are expressed on a trend basis, defined as a three-month moving average. [back to text]
- The Eighth Federal Reserve District comprises all of Arkansas and parts of six other states (see back cover). For purposes of this discussion, however, the Eighth District refers only to the whole states of Arkansas, Kentucky, Missouri and Tennessee—unless noted otherwise. [back to text]
- GDP data are not calculated on a trend basis. [back to text]

Views expressed in Regional Economist are not necessarily those of the St. Louis Fed or Federal Reserve System.
For the latest insights from our economists and other St. Louis Fed experts, visit On the Economy and subscribe.
Email Us