


Understanding the Eighth District’s Housing Market
KEY TAKEAWAYS
- As the Federal Reserve raised interest rates to fight inflation in the aftermath of the COVID-19 pandemic, the housing market was one of the first industries to be noticeably affected.
- A year and a half after the Fed’s first interest rate increase in March 2022, house-price growth in the Eighth District’s largest metro areas has slowed and inventories have risen slightly.
- Slowing single-family home and multifamily construction could continue to place upward price pressures on housing markets in five Eighth District metro areas.
The housing market garners plenty of attention in normal times, but unique shocks over the past few years have further focused awareness on one of the economy’s most important sectors. House prices saw strong growth during the COVID-19 pandemic in metro areas around the country, partly in response to a larger spending surge as household finances were supported by pandemic assistance programs and the closures of service-related segments of the economy.
When the Federal Reserve began raising interest rates in March 2022 to combat inflation, housing was one of the first industries to be substantially affected. Mortgage rates and inventories rose from their historic lows, refinancing activity fell sharply, and house prices grew more slowly in some regions and outright fell in others.
A little more than a year and a half after the Fed’s first pandemic-era interest rate increase, where does the housing market stand? A look at metro areas across the Eighth Federal Reserve District tells a story largely in line with national trends: While house-price growth has slowed and inventories have increased slightly, structural trends in housing demand have led to tight residential real estate markets. Moreover, slowing single-family and multifamily home construction could continue placing upward price pressures on the market moving forward.
House Prices in Five Eighth District Metro Areas
This article focuses on the five largest Eighth District metropolitan statistical areas (MSAs): St. Louis; Louisville, Ky.; Memphis, Tenn.; Little Rock, Ark.; and Fayetteville, Ark. As the following FRED chart shows, these MSAs all saw sharp increases in home prices—as measured by the Federal Housing Finance Agency’s All-Transactions House Price Index—beginning with the second quarter of 2021. Year-over-year percentage growth in home prices surged to some of the highest levels on record, even surpassing the increases that occurred prior to the global financial crisis of 2007-09.
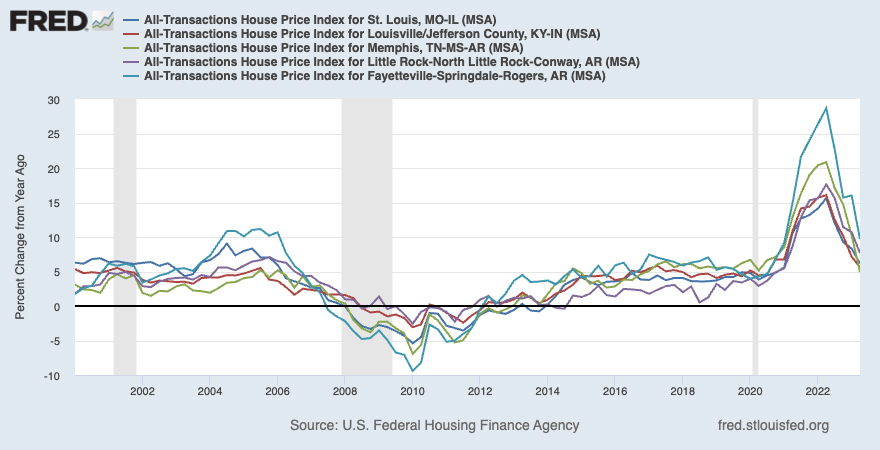
As the chart illustrates, at the market’s peak in the second quarter of 2022, all five Eighth District MSAs witnessed year-over-year house-price growth of at least 15%, with the Fayetteville MSA seeing prices surge a remarkable 28.7%. Cumulatively, the value of the average home transaction in Fayetteville increased 50% from the beginning of the pandemic to the second quarter of 2022.
House-price growth peaked in the second quarter of 2022 for each Eighth District metro area. While home prices continued to increase, the following four quarters recorded slowing year-over-year price growth. By mid-2023, Memphis’ year-over-year house-price growth was below pre-pandemic levels (4.9% in the second quarter of 2023 versus 6.7% in the first quarter of 2020). Despite decelerating, house-price growth in the two Arkansas MSAs remained the strongest among the Eighth District metro areas. Both Little Rock and Fayetteville continued to experience house-price growth well above pre-pandemic norms through mid-2023, which reflects broader secular trends—for example, high population growth—in these places.
Single-Family Housing Inventories in Eighth District Metro Areas
Interest rate hikes have slowed house-price growth, but what effects have they had on housing inventory? The figure below shows monthly single-family home inventory levels over the past eight years in the five Eighth District metro areas, indexed to February 2020.

A few key trends stand out. First, note that housing inventory had declined in four of the five largest Eighth District metro areas in the years before the pandemic; Fayetteville, where inventory levels were relatively steady, was the exception. Low levels of construction combined with demographic-driven increases in demand had tightened housing markets even before COVID-19.
Second, the rundown in inventories during the pandemic was most dramatic in the Fayetteville-area market, again a sign of the strength of demand there. In February 2022, its lowest point, the Fayetteville metro area had only 600 single-family units available for purchase at any one time—down 75% from February 2020.
Finally, while housing inventories in the five Eighth District metro areas have risen slightly from their lows in the first quarter of 2022, they remain well below their pre-pandemic averages. Inventory in Memphis has come closest to fully recovering, with its June 2023 inventory level at 94% of its February 2020 level. However, the other four metro areas had single-family home inventories below 65% of pre-pandemic levels in that month.
Eighth District real estate contacts see these low inventory levels driving tight housing markets in the near term. While demand has slowed, the demographic factors that contributed to rising home prices before the pandemic remain—and with inventories so low, demand bounced back quickly after mortgage rates stabilized.
Building Permits: Single Family versus Multifamily
The effects of interest rate increases, of course, can be seen in both transactions and construction. Though not as immediately apparent, higher interest rates can affect developers’ ability to obtain financing for major construction projects. And a year-over-year slowdown is apparent in metro-level building permit data. When comparing the first three months of 2022 with the same period in 2023, all five Eighth District MSAs saw single-family home building permits decline.All multifamily permit data is from the Building Permit Survey, accessed through the National Association of Home Builders. St. Louis recorded the smallest decline at 20%, slightly less than Fayetteville’s 24% decrease. Memphis had the largest decline at 43%, with Louisville and Little Rock not far behind at 41% and 38%, respectively. Nationally, single-family home building permits were down 31% over the same timeframe, so the Eighth District numbers are consistent with national trends.
Multifamily building permits declined more slowly, both nationally and regionally. Over the first quarter of 2023, the number of multifamily building permits issued nationwide fell by only 1% year over year. Within the five Eighth District metro areas, the number of multifamily building permits increased by 16% over the same period, though this was largely due to a significant jump in Louisville permits. Extending the period under consideration to the first half of the year reveals that multifamily building permit growth has slowed noticeably, though still less than single-family home building permits. Through June 2023, year-over-year growth in multifamily building permits was down 12% nationally and 14% in the Eighth District MSAs.
Why might this difference exist? Because multifamily construction projects are typically larger than those for single-family homes, it may be the case that they have different financing pipelines and are slower to adjust to rate increases. It also may be the case that there was a larger shortage of multifamily housing, which made builders more confident in their ability to launch projects, even at higher interest rates.
Cooling Markets Meet Constrained Housing Supply
Interest rate increases have cooled housing markets in the Eighth District, but the structural issues that the sector faced prior to the COVID-19 pandemic still exist. Supply in particular remains constrained, leading to price pressures even at higher mortgage rates. Yet higher interest rates also have slowed construction of single-family homes across the Eighth District’s five largest MSAs. Moving forward, the challenge for these metro areas will be to continue adding housing supply at higher interest rates to moderate price growth.
Note
- All multifamily permit data is from the Building Permit Survey, accessed through the National Association of Home Builders.

Views expressed in Regional Economist are not necessarily those of the St. Louis Fed or Federal Reserve System.
For the latest insights from our economists and other St. Louis Fed experts, visit On the Economy and subscribe.
Email Us