


Mortality Reductions: Fast for Poorer Nations, Slow for Richer Nations
KEY TAKEAWAYS
- World mortality has trended down for at least 200 years, but countries have increased their life expectancies at different times in history and at different speeds.
- A sample of wealthier nations raised life expectancy from 45 to 55 sooner—starting largely in the second half of the 19th century—but more slowly, averaging 45 years.
- A sample of poorer nations raised life expectancy from 45 to 55 later—starting in the second half of the 20th century—but more quickly, averaging 22 years.
World mortality has trended down for at least 200 years: 37 out of every thousand people alive at the start of 1800 died that year. In comparison, 32 out of every thousand people died in 1900, and only eight out of every thousand people died in 2000.See data from the World Bank and the Human Mortality Database. But there are at least three types of noticeable differences in this downward trend across countries:
- Some countries have higher mortality levels than others, even though mortality may have declined overall
- Some countries experienced mortality reductions at different times
- Some countries experienced faster mortality reductions than others
This article examines the second and third points. To do so, I compared the mortality reductions that started during the 19th century in a sample of today’s wealthier countries with the mortality reductions that occurred in the second half of the 20th century in a selection of today’s developing countries. This analysis allows us to answer a valuable question: How does the experience of today’s poorer countries contrast with the past experience of today’s richer countries?
Death Rate and Life Expectancy: Two Measures of Mortality
It is useful to start our discussion by describing two key mortality statistics: crude death rate and life expectancy at birth.
The crude death rate is the number of deaths per each thousand people in a given year. It is an intuitive measure, yet it has an important limitation: It can rise or fall for reasons unrelated to individuals’ risk of death. Suppose, for instance, that births increase or that a large number of young immigrants enter a country. Because young people are less likely to die than older people, the larger proportion of young people would generally lead to a decrease in the crude death rate even though there has been no change in the risk of death to individuals.
Life expectancy at birth (or simply life expectancy) is an alternative measure of mortality that does not suffer from the same disadvantage as the crude death rate. Life expectancy is the average number of years that a newborn would live if they experienced, throughout their lives, the death probabilities by age observed at the time of their birth. Unlike the crude death rate, life expectancy is independent of the age composition of the population and, thus, unaffected by changes in births or immigration. An increase in life expectancy reflects a decrease in the risk of death, so I will discuss reductions in mortality using life expectancy statistics.
Mortality Reductions in Richer vs. Poorer Countries
I compared life expectancy in a set of poorer countries to that in a set of richer countries. The 11 poorer countries—Bangladesh, Burkina Faso, Burundi, India, Malawi, Myanmar, Nepal, Pakistan, Rwanda, Sierra Leone and Togo—were very poor, as each had gross domestic product (GDP) per capita in 1960 under 2.5% of U.S. GDP per capita that year.The data for poorer countries starts in 1960 and comes from the World Bank. The countries in this sample are those for which mortality and GDP data were available and that fell under the stated threshold for GDP per capita. The eight richer countries—Belgium, Denmark, England and Wales, Finland, France, the Netherlands, Norway and Sweden—already had increasing life expectancy in the 19th century.The data for richer countries comes from the Human Mortality Database. The countries in this sample are those for which data were available.
In general, the eight wealthier, Western European countries reached a life expectancy of 45 years during the second half of the 19th century, while the 11 poorer, developing countries reached a life expectancy of 45 years in the second half of the 20th century.
To compare the speed of mortality reduction, I computed the number of years that it took for these countries to increase their life expectancy from 45 years to 55 years. (Remember that decreases in mortality are reflected by increases in life expectancy.) The following figure reports the results for the set of poorer countries in red:
- Nepal and Sierra Leone experienced the fastest reduction in mortality: It took 14 years (from 1977 to 1991 for Nepal and from 2005 to 2019 for Sierra Leone) for life expectancy to increase from 45 to 55.
- Among the poorer countries, Burundi experienced the slowest decrease in mortality. It took 33 years (more than double the time needed by Nepal and Sierra Leone) to accomplish the 45-to-55 increase in life expectancy there.
- On average, it took life expectancy 22 years to increase from 45 to 55 in the set of poorer countries.
Number of Years for Life Expectancy to Increase from 45 to 55
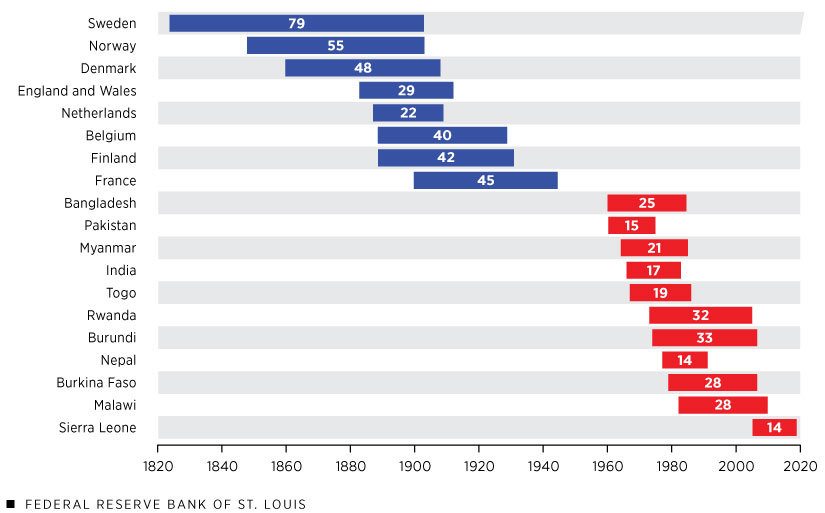
SOURCES: World Bank and Human Mortality Database.
The figure also reports analogous statistics, in blue, for the set of richer, Western European countries. The country with the fastest rise in life expectancy, the Netherlands, took only 22 years to effect the 45-to-55 increase. This duration is similar to that experienced by Myanmar almost a century later. Similarly, England and Wales took 29 years for life expectancy to increase from 45 to 55, on par with Burkina Faso and Malawi again about a century later.
Aside from the Netherlands and England and Wales, no other Western European country in the sample experienced a transition in life expectancy from 45 to 55 nearly as rapid as those from the sample of today’s poorer countries. Belgium, for instance, took 40 years to reach this milestone, while the slowest poorer country took just 33 years. Sweden, the country with the slowest increase in life expectancy, took 79 years, more than five times longer than Nepal.
The average length of time for life expectancy to increase from 45 to 55 was 45 years in the richer countries versus 22 years in the poorer countries. In sum, the same increase in life expectancy was noticeably slower in today’s richer countries than it was in today’s poorer countries.
Why Did Mortality Fall Faster in Poorer Countries?
The answer to why mortality decreased more rapidly in the poorer countries is not obvious. But at least one possible explanation—economic growth—can be quicky dismissed, because the poorer countries in this analysis are not growing faster than the richer ones.
Another possible explanation follows from the work of historian Joel Mokyr, among others. The key idea is that some individual-level practices affect mortality, and the diffusion of these practices is paramount to reducing mortality at a country level.For a more detailed discussion of this concept, see Joel Mokyr’s 2000 article in The Journal of Economic History, “Why ‘More Work for Mother?’ Knowledge and Household Behavior, 1870-1945,” and his 1993 article in The American Economic Review, “Technological Progress and the Decline of European Mortality.”
Many such practices are related to basic hygiene. For instance, the development of the germ theory of disease during the 19th century led to the practice of boiling water to prevent the spread of cholera. Boiling water is “cheap” and does not require special skill or medical infrastructure, so wider adoption of this practice can easily reduce death from many types of water-borne illnesses.
Besides boiling water, many other practices can affect one’s mortality risk, such as breastfeeding, adult dietary habits, personal hygiene, household cleanliness, food handling, use of soap, sexual behavior, use of contraceptives, pregnancy care, tobacco and alcohol use, and exercise. Knowledge of “cheap” practices that can lower mortality risk does not imply they are automatically accepted and used, however. Vaccines or contraceptive practices, for instance, have sometimes been opposed on religious and/or cultural grounds.
In 19th century Europe, then-new practices diffused slowly through the so-called hygienist movement and the advent of germ theory with the works of Louis Pasteur and Robert Koch. The Ladies’ National Association for the Diffusion of Sanitary Knowledge, for example, was founded in England in 1857 with the goal of informing people about sanitary practices via pamphlets, lectures and newspaper articles. During the 20th century, the same ideas were more established and their diffusion likely faster, even in poorer countries, and possibly with the help of richer countries. Faster diffusion would imply faster mortality reductions in later-developing countries and explain why Nepal was able to increase its life expectancy from 45 to 55 in 14 years while, 153 years earlier, Sweden took nearly 80 years to accomplish the same gain.
Notes
- See data from the World Bank and the Human Mortality Database.
- The data for poorer countries starts in 1960 and comes from the World Bank. The countries in this sample are those for which mortality and GDP data were available and that fell under the stated threshold for GDP per capita.
- The data for richer countries comes from the Human Mortality Database. The countries in this sample are those for which data were available.
- For a more detailed discussion of this concept, see Joel Mokyr’s 2000 article in The Journal of Economic History, “Why ‘More Work for Mother?’ Knowledge and Household Behavior, 1870-1945,” and his 1993 article in The American Economic Review, “Technological Progress and the Decline of European Mortality.”

Views expressed in Regional Economist are not necessarily those of the St. Louis Fed or Federal Reserve System.
For the latest insights from our economists and other St. Louis Fed experts, visit On the Economy and subscribe.
Email Us