


The Impact of Inflation’s Wealth Transfer Effect
KEY TAKEAWAYS
- The populations of a sample of advanced economies hold large amounts of assets that earn little interest. Coupled with high inflation, this implies a significant loss in purchasing power.
- Through this process, unexpected inflation works to transfer wealth from lenders to borrowers; borrowers benefit because they can pay back their loans in depreciated money.
- Households can be lenders and borrowers at the same time. For instance, a household may have money in a checking account—essentially a loan to the bank—and a mortgage.
Recent high inflation certainly has affected consumers’ pocketbooks; by one measure, it has reduced the purchasing power of certain U.S. financial assets—demand deposits, time deposits and savings deposits—by nearly $1.8 trillion for the 12-month period ending March 2022. In this article, we quantify the purchasing power that such assets have lost due to inflation, both in the U.S. and across other advanced economies.
At the same time, unexpected higher inflation has also resulted in a significant transfer of wealth from lenders to borrowers by lowering the real value of nominal debt. In this way, inflation redistributes wealth from richer, older households that are creditors to younger, middle-class households with fixed mortgage debt.
Inflation Erodes the Purchasing Power of Money
Inflation erodes the purchasing power of money, both the physical currency in one’s wallet and other financial assets easily available for purchases, such as demand deposits. Typically, demand deposits—which are deposits that can be withdrawn as and when required, like the money in a checking account at your local bank—provide negligible returns, so a large increase in the rate of inflation could significantly reduce the purchasing power of these holdings.
For example, the average U.S. checking account pays annual interest of 0.03%,As of July 18, 2022. The latest U.S. account rates are available from the Federal Deposit Insurance Corp.’s national rates and rate caps table. and inflation in the U.S. as of March 2022 was at 8.5%. Therefore, the purchasing power of demand deposits in the U.S. effectively declined by 8.47% from March 2021 to March 2022.
Do Borrowers Experience an Upside to Inflation?
Inflation can hurt consumers’ pocketbooks, but it also lowers the real value of nominal debt. St. Louis Fed economist YiLi Chien explains how inflation transfers wealth from lenders to borrowers, and the trade-off this represents for households who are both.

Transcript: Do Borrowers Experience an Upside to Inflation?
Chien: Unexpected inflation can hurt a consumer’s pocketbook. The reason is very simple, because the money you put in a checking or savings account is going to buy less goods and services because of inflation.
On the other hand, for some households, especially for households who have debt, inflation could have an upside. This is because inflation not only reduces the value of your assets, but also reduces the value of your liabilities. So, basically, you can repay your debt with depreciated dollars.
It’s also important to recognize that even the same household could have an asset and a liability position. For example, a household could have a savings or checking account in the bank, so essentially they are lending to the bank. And this asset position is going to get hurt if inflation is high.
Exactly the same consumer or household could have a liability position. For example, they could borrow from the bank in the form of a mortgage. And the value of the mortgage is going to reduce because of inflation.
So the net benefit or cost for a specific household depends on its liability and asset position. But it is very important to understand this underlying mechanism, which is essentially a wealth transfer between lender and borrower.
Inflation Rates Surged across Many Advanced Economies
Inflation has increased significantly across advanced economies. The following figure plots the March 2022 consumer price index annual inflation rates for a selection of advanced economies and compares them with the inflation rates from one year prior (March 2021).
Inflation increased for all the countries in our sample, which comprised all Organization for Economic Cooperation and Development member nations for which data were available. The difference between March 2021 and March 2022 inflation rates ranged from more than 10 percentage points in Greece to about 1.4 percentage points in Norway. This figure illustrates that recent inflation has been an international phenomenon. What’s more, high inflation has continued for these advanced economies. For example, U.S. inflation reached 8.5% year over year in July.
Inflation Rates among Advanced Economies
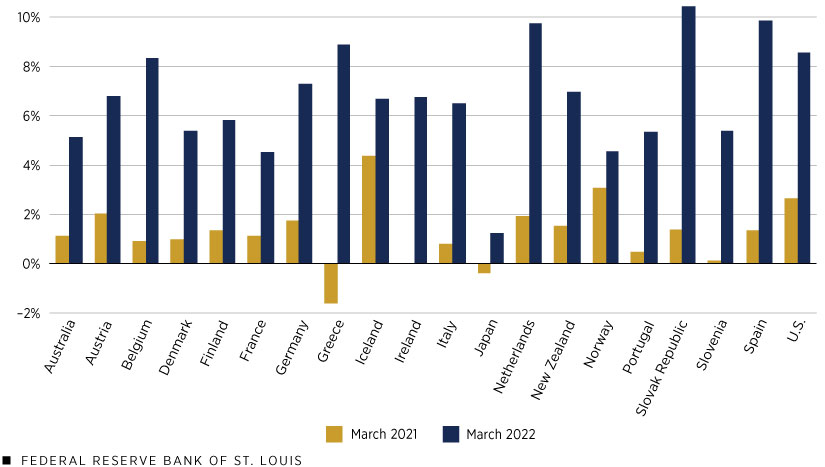
SOURCES: IMF and authors’ calculations.
NOTE: Ireland recorded 0% inflation in March 2021.
The Spread between Inflation Rates and Deposit Rates Is Large
The following table shows that deposit rates—the annual interest rates paid by financial institutions to consumers on demand deposits—are very low and even close to zero for most of these countries.The International Monetary Fund’s International Financial Statistics database did not contain deposit rate information for all the countries in our sample. For Australia, Denmark, Japan and the U.S., we referred to each country’s respective central bank website for this information. Data for New Zealand and Norway is from OECD. The low deposit rates, together with high inflation, imply negative realized returns from demand deposits for all the countries in the sample.The realized return for each country in the table would be the difference between its deposit rate and inflation rate.
| Netherlands | 1.04% |
|---|---|
| New Zealand | 1.02% |
| Italy | 0.81% |
| France | 0.50% |
| Belgium | 0.39% |
| Slovak Republic | 0.34% |
| Norway | 0.30% |
| Germany | 0.25% |
| Finland | 0.21% |
| Slovenia | 0.17% |
| Greece | 0.16% |
| Australia | 0.10% |
| Austria | 0.10% |
| Ireland | 0.09% |
| Portugal | 0.08% |
| U.S. | 0.07% |
| Spain | 0.03% |
| Denmark | 0.00% |
| Japan | -0.15% |
| SOURCES: IMF, OECD, Federal Reserve, Reserve Bank of Australia, Denmark National Bank and Bank of Japan. | |
| NOTES: Deposit rate information for Iceland was not available. Deposit rates are as of March 2021, the first month of our analysis. | |
The Reduction of Purchasing Power
Households and firms in the advanced economies we analyzed hold significant amounts of demand deposits. This implies that the stark difference between inflation rates and deposit rates significantly reduces the purchasing power of such deposits. To quantify this decline, we collected March 2021 demand deposit data from the International Monetary Fund’s International Financial Statistics database. We then normalized demand deposit levels relative to each country’s nominal gross domestic product (GDP) for better cross-country comparison.
The blue bars in the following figure show the ratio of estimated demand deposits to nominal GDP for each country in the sample.Estimated demand deposits are measured as transfer deposits included in broad money liabilities at depository corporations. The gold bars represent each country’s loss in demand deposit purchasing power as a percentage of nominal GDP, which we calculated as the product of total demand deposits and the inflation rate net the deposit rate, normalized by nominal GDP.The formula for the lost purchasing power of demand deposits (DD) relative to nominal GDP (NGDP) is calculated as (DD/NGDP) * (π-i), where π denotes the inflation rate and i represents the deposit rate.
Demand Deposit Ratios and Lost Purchasing Power
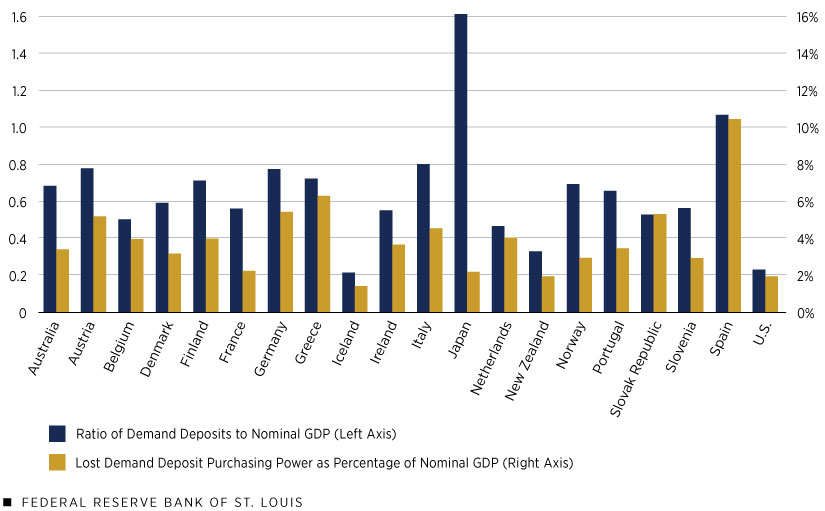
SOURCES: IMF, OECD and authors’ calculations.
NOTE: Lost purchasing power was calculated using March 2022 demand deposit and inflation levels.
The figure illustrates significant declines in purchasing power. Spain and Germany, for example, saw demand deposit purchasing power fall by 10.4% and 5.4%, respectively, of nominal GDP, which is correspondingly about 120 billion euros and 185 billion euros. This significant reduction was attributable to both high levels of inflation and their relatively large ratios of demand deposits to nominal GDP. Even for a country like Japan, whose inflation rate stood at only 1.2% in March 2022, the loss of purchasing power was still quite significant at 2.2% of nominal GDP because its demand deposits were 1.6 times the size of its nominal GDP.
A Conservative Measure
Our calculation for lost purchasing power is conservative in that it covers only demand deposits. When considering money in all forms, these deposits make up just a fraction of the total. Should other noncash financial assets that are easily converted to cash be included in this exercise, the purchasing power erased in recent inflation shocks would increase.
In the U.S., for example, time deposits—such as certificates of deposit, or CDs—and savings deposits—such as certain savings or money market accounts—are three times larger than demand deposits.Quarterly U.S. time and savings deposits are reported in financial accounts data on the Federal Reserve System Board of Governors website. Much like demand deposits, the returns on these assets are extremely low. Also like demand deposits, the reduction in their purchasing power would be similar to the total inflation rate. Including time deposits and savings deposits in the calculation would quadruple the purchasing power losses in the U.S. from 1.9% of nominal GDP to 8% of nominal GDP, or $1.77 trillion.For simplicity, we assumed that the nominal return of all time and savings deposits was 1%.
How Far Has Purchasing Power Declined in the Face of Inflation?
Recent inflation means that money now buys less than it did before. But how much less? St. Louis Fed Research Associate Jason Dunn explains how far inflation reduced the purchasing power of certain U.S. assets, such as checking accounts.
Transcript: How Far Has Purchasing Power Declined in the Face of Inflation?
Dunn: U.S. households hold a significant amount of their money in demand deposits. By demand deposits, I’m referring to checking accounts at a local bank.
Now, the interest rate returns on these demand deposits are essentially zero. If you couple this with the high inflation rates that we’ve observed over the past year, that implies a pretty significant reduction in purchasing power.
But how much is this loss exactly?
Our data shows that U.S. demand deposits over the past year have lost purchasing power of about 1.9% of nominal gross domestic product, or roughly $418 billion. If we compare this to other countries, this is actually on the lower end, because other advanced economies actually hold a larger proportion of their money in demand deposits.
And then on top of that, demand deposits are just one of many financial assets. So, if we also included time deposits, such as CDs, and savings deposits, that would quadruple the figure to nearly $1.8 trillion.
This is all to say that the impact of high inflation and the loss of purchasing power is very significant. The effects vary across countries as well as between individual households.
Inflation Is a Wealth Transfer from Creditors to Debtors
Massive reductions in the purchasing power of demand, time and savings deposits can hurt account holders, but others likely benefit. For example, unexpected higher inflation transfers purchasing power from the holder of a time deposit to the commercial bank at which the deposit is held. (Unexpected lower inflation, of course, does the opposite.) However, while higher inflation does erode the real value of nominal assets, such as demand deposits, it also lowers the real value of nominal liabilities, such as mortgages. So, borrowers directly benefit from unexpected inflation because they can pay back their loans in depreciated money. In the same way, lenders lose out.
It is quite common for households to be creditors and debtors at the same time. For example, a household could hold demand deposits—a lending asset that will experience a loss in purchasing power from an increase in inflation—and also borrow in the form of a fixed-rate mortgage—a liability that will experience a reduction in real value from higher inflation. The net benefit or loss for households such as these would depend on their exact composition of assets and liabilities. But given that household asset compositions are known to vary widely, the recent rise in inflation must have caused a significant amount of wealth transfer across households.
How Does Unexpected Inflation Redistribute Wealth?
Inflation transfers wealth from lenders to borrowers, but who, exactly, tends to benefit from this? St. Louis Fed economist YiLi Chien explains how inflation’s wealth redistribution effect could impact certain households and U.S. taxpayers.
Transcript: How Does Unexpected Inflation Redistribute Wealth?
Chien: Inflation can cause a large wealth transfer from the lender to the borrower. According to the past research and economic data, there are at least two general points we can make here.
The first one is, if you look at household wealth distribution, you will find that richer and older households tend to be the lenders of this economy. On the other side will be the middle-income households, which tend to be a big borrower of this economy.
So, unexpected inflation can induce a wealth transfer from the richer and older households to the younger and middle-income households with fixed mortgage debt.
The second thing is that one of the biggest borrowers in the economy is the government. If you look at U.S. national debt, it is more than $30 trillion, which is a huge amount. And inflation is going to reduce the real value of this debt at the expense of the bondholders.
Since the government debt is backed up by current and future tax revenue, it is likely to be the case that the reduction of government debt is going to benefit the current and future taxpayer.
The Impact of Unexpected Inflation on the Distribution of Wealth
While a full picture of how unexpected inflation affects wealth distribution would require a lot of information about the type and amount of people’s assets and liabilities, we can make two general points. First, as a 2006 study from Matthias Doepke and Martin Schneider concluded, even unexpected moderate inflation substantially redistributes wealth among households.See Matthias Doepke and Martin Schneider’s December 2006 article, “Inflation and the Redistribution of Nominal Wealth,” in the Journal of Political Economy. In general, wealth transfers from richer, older households that are creditors to younger, middle-class households with fixed mortgage debt.
Second, most governments of countries with advanced economies have issued large amounts of nominal debt.See government debt data from OECD for its member countries. High levels of inflation will reduce the real value of such debt at the expense of those who own it—that is, bondholders. Given that government debt is paid for by current and future tax revenue, a reduction in its real value is likely to benefit current taxpayers and even future taxpayers.
Notes
- As of July 18, 2022. The latest U.S. account rates are available from the Federal Deposit Insurance Corp.’s national rates and rate caps table.
- The International Monetary Fund’s International Financial Statistics database did not contain deposit rate information for all the countries in our sample. For Australia, Denmark, Japan and the U.S., we referred to each country’s respective central bank website for this information. Data for New Zealand and Norway is from OECD.
- The realized return for each country in the table would be the difference between its deposit rate and inflation rate.
- Estimated demand deposits are measured as transfer deposits included in broad money liabilities at depository corporations.
- The formula for the lost purchasing power of demand deposits (DD) relative to nominal GDP (NGDP) is calculated as (DD/NGDP) * (π-i), where π denotes the inflation rate and i represents the deposit rate.
- Quarterly U.S. time and savings deposits are reported in financial accounts data on the Federal Reserve System Board of Governors website.
- For simplicity, we assumed that the nominal return of all time and savings deposits was 1%.
- See Matthias Doepke and Martin Schneider’s December 2006 article, “Inflation and the Redistribution of Nominal Wealth,” in the Journal of Political Economy.
- See government debt data from OECD for its member countries.


Views expressed in Regional Economist are not necessarily those of the St. Louis Fed or Federal Reserve System.
For the latest insights from our economists and other St. Louis Fed experts, visit On the Economy and subscribe.
Email Us