The Differences between Prices and Inflation Explained
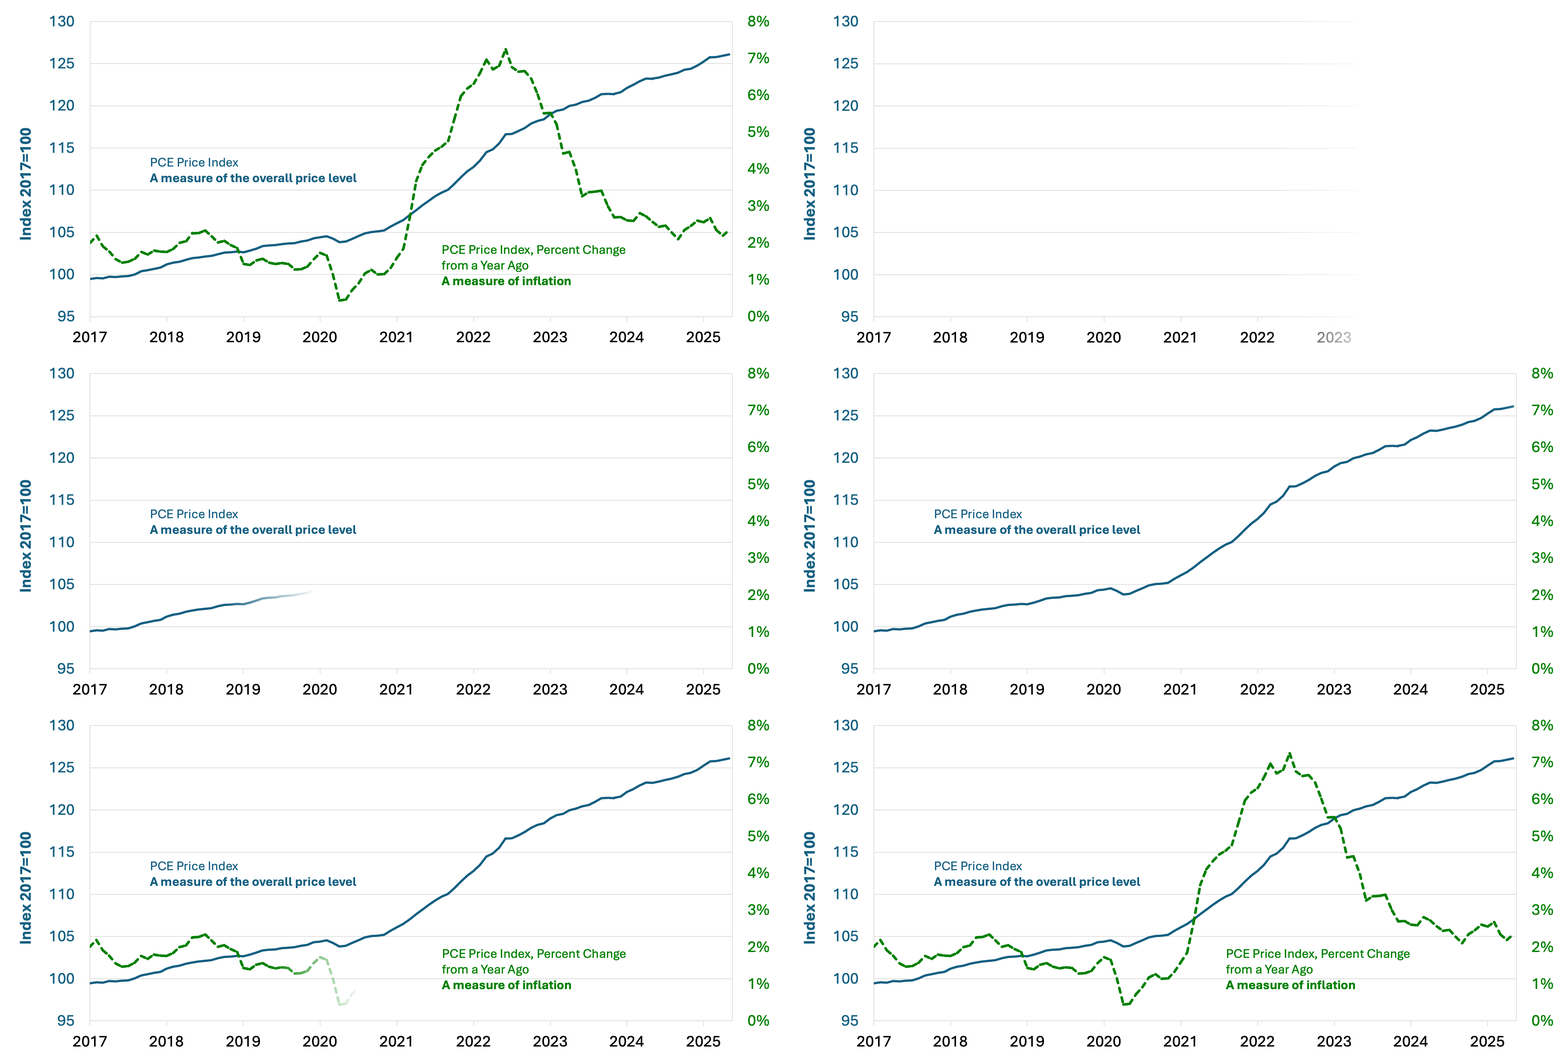
In recent years, people have seen higher prices for all kinds of items, including groceries. Overall, the U.S. economy has experienced higher inflation than at any other point in the past several decades. The percentage change from a year ago in the price index for personal consumption expenditures (PCE)—one measure of inflation—was 7.2% in June 2022. That annual rate has since fallen and was at 2.3% in May 2025.
That’s a big decrease, and the inflation rate is closer to the Federal Reserve’s 2% target. But products and services can still seem expensive to consumers. If inflation is lower than it was a few years ago, why are prices still higher than before?
The answer lies in understanding the differences between individual prices, an overall price level and inflation. This blog post explains those differences. It also addresses other questions, including:
- Which price increases do consumers tend to notice more?
- Which items tend to see faster—and which ones tend to see slower—price increases?
- What causes temporary changes in prices? How about more permanent changes?
Prices vs. an Overall Price Level vs. Inflation
We all see individual prices on items when we go to the store or shop online. And we see that prices for different goods and services can move in opposite directions and can increase or decrease by varying amounts.
To get a sense of how overall prices are changing in an economy, economists and others look at price indexes, which take the pulse of many goods and services. As described in a previous Open Vault post, price indexes—like the previously mentioned PCE price index and the consumer price index (CPI)—are used to estimate inflation.
The price level refers to the average level of prices of goods and services in an economy, as discussed in a March 2024 Page One Economics article.
Inflation is a general, sustained upward movement in the price level, or in overall prices over a certain period of time, rather than in the price of a single item.
The animated graph below shows the PCE price index (left axis) as well as the percentage change from a year ago in that index (right axis) since 2017. The latter is the measure the Fed’s 2% target is based on.
Price Level vs. Inflation Rate Example

SOURCE: U.S. Bureau of Economic Analysis via FRED.
NOTES: PCE price index refers to the personal consumption expenditures price index. The graph shows data from January 2017 to May 2025.
As you can see from the chart, the overall PCE price index has continued to increase in recent years but at a slower pace. This is evidenced by a declining—but still positive—rate of inflation since mid-2022. (Did you know? A slowing of the inflation rate, while remaining positive, is known as disinflation.)
What Is an Easy Way to Think about Price Levels vs. Inflation?
In a conversation with Serdar Ozkan, an economic policy advisor and economist in the St. Louis Fed’s Research division, he gave me two analogies:
- Imagine you’re driving 70 miles per hour and then slow to 40 miles per hour. You’re still moving forward but at a slower pace.
- Let’s say your salary increases by 8% one year and 4% the next year. Your overall salary is still higher than before, but the rate of increase wasn’t as fast.
The concept of inflation is similar. “Inflation is about the change in prices or the growth rate,” Ozkan said. “The price level is different.”
Think of the price level in the examples as the total distance covered versus the speed you’re going, or as the total amount of your salary versus how fast it’s increasing.
Which Price Increases Do Consumers Tend to Notice More?
While inflation refers to an increase in the overall price level, people take note of price increases for individual items.
Which ones? “The ones they buy frequently,” like eggs and gas, Ozkan said.
People’s past experience also can affect how they view inflation overall. Ozkan grew up in Turkey, which historically has had a high-inflation problem, he said.
“But for my peers who grew up in the U.S. after the 1980s, there was never really too much inflation,” he said.
In the few decades before the COVID-19 pandemic, the overall price level continued to rise but fairly slowly, meaning inflation was fairly low and stable over that period. In fact, for the several years leading up to the pandemic, PCE inflation averaged less than 2%. But after the pandemic, the U.S. experienced a big inflation shock. “So that’s why I think people are also affected quite a bit,” he said.
Which Items Tend to See Faster (or Slower) Price Increases?
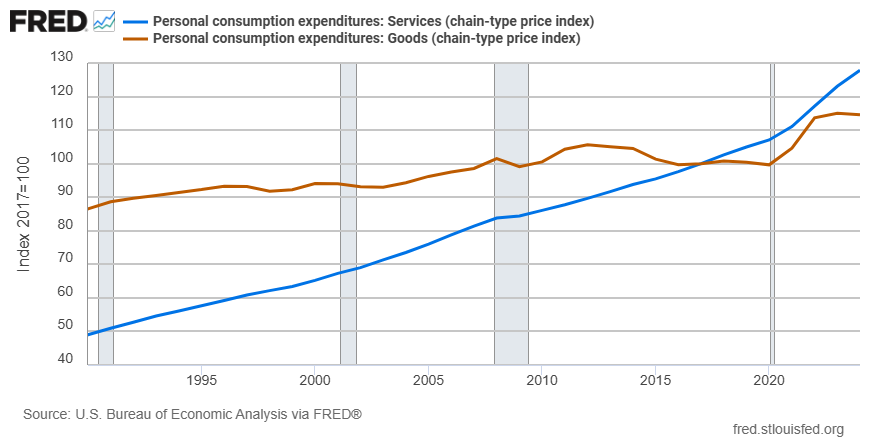
Ozkan said prices for services (e.g., health care and education) tend to increase faster than prices for goods (e.g., electronics and furniture). The difference can be seen in the first graph from online database FRED below.
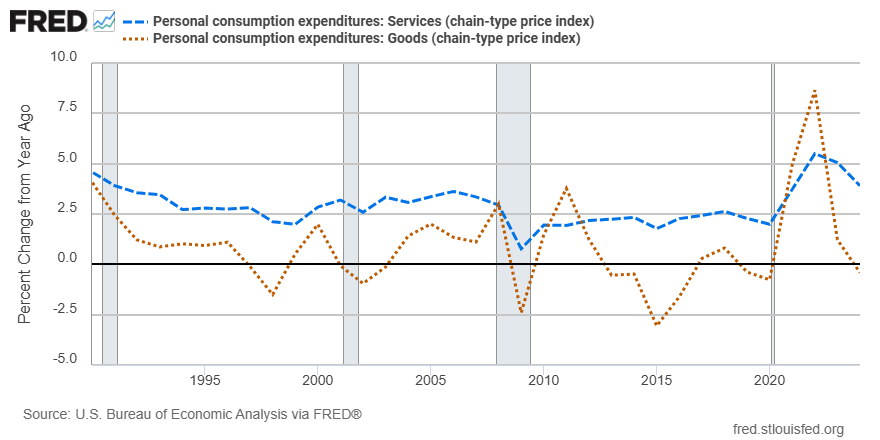
In other words, services inflation tends to be higher than goods inflation, as shown in the second FRED graph. (Of course, there are exceptions, like in 2021 and 2022, when goods inflation was higher than services inflation.) Ozkan noted that goods—particularly durable goods—sometimes have negative inflation (i.e., deflation); their prices sometimes decrease after accounting for quality.


Why might services prices tend to increase faster over time?
Ozkan explained that productivity gains in producing goods have made those items cheaper over time. For example, many parts of a manufacturing process are automated and handled by machines, which makes production much cheaper.
On the other hand, services tend to be labor intensive, and it’s more difficult to have similar productivity gains, he said. He cited barbers as an example. They can probably give the same number of haircuts per hour now as they did 50 years ago, so their productivity hasn’t really changed much.
Average Inflation Rate from 1990-2024
 SOURCE: Calculations based on the annual personal consumption expenditures price index for services and for goods from the U.S. Bureau of Economic Analysis.
What Causes Temporary Changes in Prices vs. More Permanent Changes?
Some price changes are expected to be temporary while others are more permanent. What might drive these types of price changes?
Ozkan gave three examples of factors that can affect prices temporarily:
- A bird flu that reduces the number of egg-laying chickens and, in turn, eggs. The resulting decline in egg production causes egg prices to increase, but prices would be expected to go back down once egg production can increase.
- Weather-related effects on crops. For example, hotter or colder temperatures or higher or lower rainfall than average could limit the supply of a certain crop, causing its price to go up.
- Seasonal factors. During the holiday season, airline tickets and hotel prices might increase, for instance.
Ozkan mentioned structural changes in the economy as one factor that can cause permanent or longer-lasting changes in prices. The aging population, for example, is increasing the demand for health care, causing health care prices to increase.
Why Does the Federal Reserve Target 2% Inflation?
As mentioned earlier, the Federal Reserve aims for an inflation rate of 2%, rather than something like 0% or a negative number.
When it comes to monetary policy, the Federal Reserve has a mandate from Congress to promote maximum employment and price stability. The Federal Open Market Committee, the Fed’s main monetary policymaking body, judges that an inflation rate of 2% over the longer run is most consistent with this mandate, as noted in a Board of Governors FAQ.
“When households and businesses can reasonably expect inflation to remain low and stable, they are able to make sound decisions regarding saving, borrowing, and investment, which contributes to a well-functioning economy,” the FAQ says.
This blog explains everyday economics and the Fed, while also spotlighting St. Louis Fed people and programs. Views expressed are not necessarily those of the St. Louis Fed or Federal Reserve System.
Email Us


