


The Uneven Heartland: A Look at Household Wealth in the Midwest and Southeast
Understanding household wealth trends is important for getting a pulse on the economic health and stability of a community. Wealth can be used to invest in oneself and one’s family, meet future needs, provide access to opportunities, and cushion the impact of unexpected financial shocks. Wealth provides a more complete picture of financial well-being than income alone, but until recently, household wealth estimates have been available at only a national level. Having estimates of local wealth enables communities and organizations to place resources to build financial stability where they are most needed.
We used the publicly available files from the Geographic Wealth Inequality Database, or GEOWEALTH-US, to look at local wealth estimates. (See box for more information on the database.)
Using those estimates, we found that there are pockets of both prosperity and financial insecurity within communities. High- and low-wealth areas can exist within a few miles. Further, significant and rising wealth inequality exists. This blog post focuses on seven states: Arkansas, Illinois, Indiana, Kentucky, Mississippi, Missouri and Tennessee. All of Arkansas and portions of the other states make up the Eighth Federal Reserve District.
States Grow More Unequal; Mississippi and Arkansas Ranked 49th and 50th
Typical households in the seven states had wealth levels that were lower than those in many other states across the country, as can be seen in the map.
Median Household Wealth, 2020
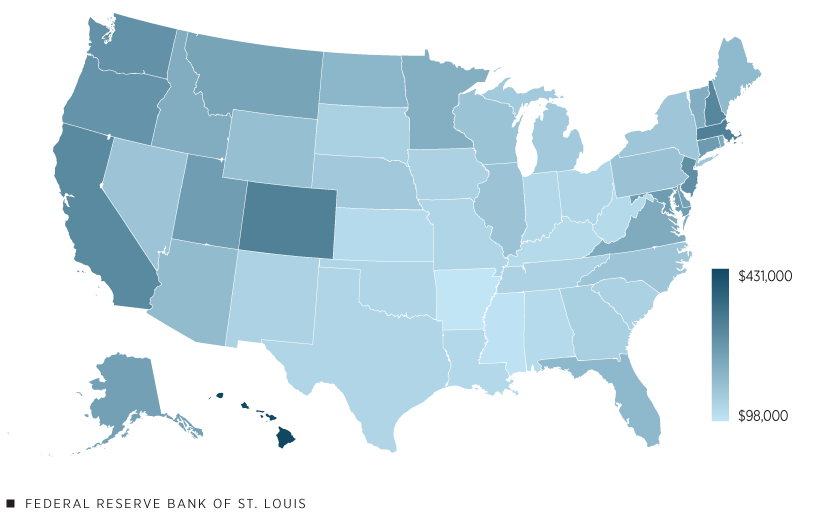
SOURCE: GEOWEALTH-US.
In 2020, the median household in Illinois held around $170,000 in wealth. Illinois was the wealthiest of the seven states, but it was still in the bottom half of all states, at 27th. Tennessee also ranked in the bottom half—38th—with a median household wealth of $138,000. The five other states had median households among the least wealthy in the country:
- Missouri, with $132,000, was 41st.
- Indiana, with $127,000, was 43rd.
- Kentucky, with $120,000, was 47th.
- Mississippi, with $103,000, was 49th.
- Arkansas was 50th—at the bottom—with $99,000.
It’s also informative to look at wealth inequality within states. We might want to know if a small number of households have most of a state’s household wealth, or if wealth is more evenly distributed. How has this distribution changed over time? In general, wealth inequality has been on the rise in those seven states over the past several decades.
In the 1980s, 10% of households owned just over half of all household wealth, ranging from 51% in Indiana to 56% in Arkansas and Tennessee. By 2020, these shares had increased an average of 11 percentage points, to range from 63% to 66%.The February 2024 paper by Suss, Kemeny and Connor published in Nature: Scientific Data also estimated Gini coefficients, which measure inequality. Gini coefficients showed that inequality had risen markedly over the past several decades. The shares for the top 10% of households in the other 43 states are similar, with a somewhat larger range. Standard errors and confidence intervals are not available in GEOWEALTH-US. Furthermore, the top 1% of the population in these states had about a third of household wealth in 2020, up from about one-fifth of the wealth in 1980. This means that household wealth had become more concentrated, with most of the gains going to the very wealthiest households. Inequality rose by a similar amount across all 50 states during this time period.
Wide Range of Economic Well-being in Cities
Drilling down to smaller levels of geography reveals a great deal of variation within states. Public Use Microdata Areas, or PUMAs, are non-overlapping geographic areas that contain at least 100,000 people.PUMAs, which are used by the U.S. Census Bureau, are contained within a single state and generally follow county boundaries, though large counties are often divided and smaller counties can be grouped together. Exploring wealth at these small scales is informative because it gives a deeper understanding of economic opportunity and disadvantage within communities.
The table below shows the highest and lowest PUMAs by median wealth in each of the seven states in 2020. Many metropolitan areas contain communities with very different wealth levels, where prosperity exists only a few miles away from asset poverty. (Click for a spreadsheet with complete lists of 2020 median household wealth for U.S. states and Eighth District PUMAs.)
In several states, the wealthiest PUMA was in the same metropolitan area as the poorest PUMA. Consider the St. Louis metro: The St. Louis County (Central) PUMAThis and the other PUMA names are the official U.S. Census Bureau names. had a median household wealth of $373,000, the highest in the state. The bottom PUMA in Missouri was St. Louis City (North), with a median of $19,000. These PUMAs are adjacent to one another. Estimates for PUMAs across the rest of the country are available for download in the GEOWEALTH-US data.
| State | PUMA | Major City (Metro) | Median Household Wealth (2020) |
|---|---|---|---|
| Arkansas | Benton County | Rogers (Northwest Arkansas) | $156,000 |
| St. Francis, Poinsett, Phillips, Cross, Lee and Monroe counties | Forrest City (Memphis) | $64,000 | |
| Illinois | Cook County (Northeast)—Northfield and New Trier townships* | Chicago (Chicago) | $1,074,000 |
| Chicago City (South)—South Shore, Hyde Park, Woodlawn, Grand Boulevard and Douglas* | Chicago (Chicago) | $17,000 | |
| Indiana | Hamilton County (Central)—Carmel City and Fishers Town (West) | Carmel (Indianapolis) | $301,000 |
| Lake County (Northeast)—Gary City and Griffith Town | Gary (Chicago) | $39,000 | |
| Kentucky | KIPDA Area Development District (West)—Louisville/Jefferson County (Northeast)* | Louisville (Louisville) | $321,000 |
| KIPDA Area Development District (West)—Louisville/Jefferson County (Northwest)* | Louisville (Louisville) | $30,000 | |
| Missouri | St. Louis County (Central)* | St. Louis (St. Louis) | $373,000 |
| St. Louis City (North)* | St. Louis (St. Louis) | $19,000 | |
| Mississippi | South Region—Pearl River, Hancock, George and Stone counties | Picayune (New Orleans) | $193,000 |
| Central Region—Jackson City (East and Central) | Jackson (Jackson) | $40,000 | |
| Tennessee | Williamson County—Franklin and Brentwood cities | Franklin (Nashville) | $521,000 |
| Memphis City (Central Riverside) | Memphis (Memphis) | $14,000 | |
| NOTES: “Major City” is the most populous city in that PUMA. An asterisk indicates the PUMAs in a state are within 20 miles of each other. | |||
| SOURCE: GEOWEALTH-US. | |||
Wealth Variety across Nation Means No Cookie-Cutter Solutions
The uneven distribution of wealth and continued growth in wealth inequality has far-reaching consequences. Families with low wealth may not have access to economic mobility and may find it harder to weather emergencies, invest in education or start businesses. This creates a cycle that can disadvantage future generations. On the other hand, more equitable wealth outcomes could create a more resilient economy. The GEOWEALTH-US wealth estimates allow researchers and practitioners to answer questions like, “Where in Missouri are high- and low-wealth areas adjacent?” and “How does the wealth of high-income, primarily Black areas compare with that of high-income, primarily white areas?”
The answers to these questions may help guide those seeking to expand wealth-building opportunities. Wealth provides financial support during difficult times and drives consumption and investment in good times. Yet there are cities where asset poverty exists in close proximity to riches, which impacts the economic vitality of the entire region. Using data from sources like GEOWEALTH-US can give us a greater understanding of local conditions and help steer us toward an economy that works for all.
Notes
- The February 2024 paper by Suss, Kemeny and Connor published in Nature: Scientific Data also estimated Gini coefficients, which measure inequality. Gini coefficients showed that inequality had risen markedly over the past several decades. The shares for the top 10% of households in the other 43 states are similar, with a somewhat larger range. Standard errors and confidence intervals are not available in GEOWEALTH-US.
- PUMAs, which are used by the U.S. Census Bureau, are contained within a single state and generally follow county boundaries, though large counties are often divided and smaller counties can be grouped together.
- This and the other PUMA names are the official U.S. Census Bureau names.

This blog explains everyday economics and the Fed, while also spotlighting St. Louis Fed people and programs. Views expressed are not necessarily those of the St. Louis Fed or Federal Reserve System.
Email Us