


Trends in Families’ Economic Well-Being
Overall, the share of adults in the U.S. that were doing at least OK financially in 2022 was 73%, down from 78% in 2021, according to the latest Survey of Household Economics and Decisionmaking (SHED) from the Federal Reserve Board of Governors.
The survey, which focuses on the economic well-being of U.S. households and included 11,000 adults, was conducted in October 2022. The report was released in May 2023.
Watch a short video about the latest Survey of Household Economics and Decisionmaking and the Report on the Economic Well-Being of U.S. Households. Click for a transcript.
In a Connecting Communities webinar on July 13, Ellen Merry and Alicia Lloro presented on the results of the survey. Merry and Lloro are principal economists in Consumer and Community Research at the Federal Reserve Board. Jeff Larrimore, the chief of Consumer and Community Research at the Board, also participated in the webinar, and Jennie Blizzard, a communications advisor with Fed Communities, moderated the discussion.
“Broadly speaking, we see declines across several well-being metrics and broadly across different population groups when we look at the changes over the past year,” Merry said.
A few trends that were discussed during the webinar are highlighted below. They’re related to:
- The share of people doing at least OK financially by education level
- The share of people doing worse off than a year prior
- Financial challenges that people were facing
- Job actions taken over the last year
Decline in Financial Well-Being for Most Education Levels
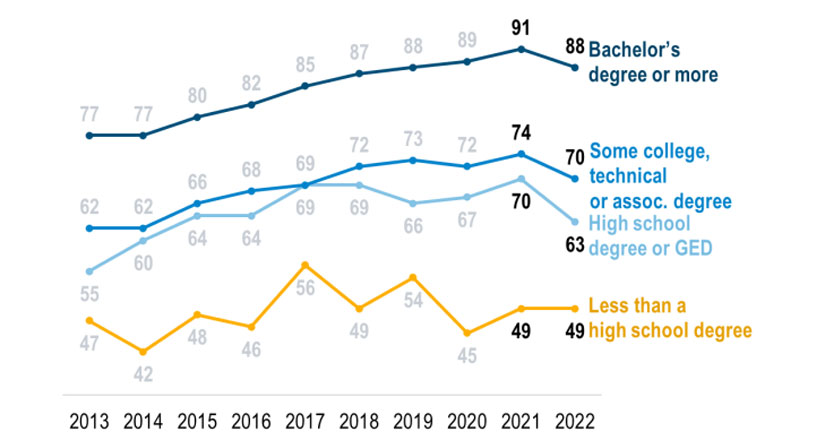
Looking at respondents by education level, the survey suggests that financial well-being (again, measured as those who said they’re doing at least OK financially) declined for each group except for those with the lowest education level, as seen in the chart below.
“Adults with at least a bachelor’s degree, who are shown in the top in dark blue, saw a decrease in financial well-being for the first time since the survey began in 2013,” Merry said. She added that the gap between those with the highest education and those with the lowest education remains large.
Shares of Most Education Groups Doing at Least OK Financially Were Lower
SOURCES: Federal Reserve Board’s Report on the Economic Well-Being of U.S. Households in 2022, released in May 2023. The graphic is from the presentation given during the July 13, 2023, Connecting Communities webinar.
NOTES: Values are percentages. Doing at least OK financially includes those who said they were doing OK and those who were living comfortably.
More People Said They Were Worse Off Financially Than 12 Months Prior
Merry also discussed results from asking respondents if they were better off, the same or worse off financially than a year ago. She pointed out that the share of adults who reported being worse off in 2022 was 35%—up from 20% in 2021 and the highest on record since the question started being asked in 2014. Conversely, the share of adults who reported being better off in 2022 was 19%—down from 25% in 2021 and the lowest since the question started being asked.
The researchers dug further into the data to find which subgroups were driving the increase in the share of people who reported being worse off financially. Merry noted that those with higher levels of education and those with more investable assets had larger increases in the share who reported being worse off financially in 2022 than a year prior, as shown in the table below.
“This pattern may reflect the fact that those with a bachelor’s degree not only faced rising prices, but because they’re more likely to have exposure to the stock market and investments more generally, they may have been more affected by the declines in the value of investments last year,” Merry said.
| By Education | Less than a high school degree | 7 ppts | |||||
|---|---|---|---|---|---|---|---|
| High school degree or GED | 14 ppts | ||||||
| Some college, technical or associate degree | 13 ppts | ||||||
| Bachelor’s degree or greater | 17 ppts | ||||||
| By Amount of Savings and Investable Assets | Less than $50,000 | 11 ppts | |||||
| $50,000-$249,999 | 16 ppts | ||||||
| $250,000-$999,999 | 19 ppts | ||||||
| $1 million or more | 31 ppts | ||||||
| SOURCE: Federal Reserve Board’s Report on the Economic Well-Being of U.S. Households in 2022, released in May 2023, and as presented in the July 13, 2023, Connecting Communities webinar. | |||||||
| NOTE: Values are the percentage point (ppt) difference in the 2022 share minus the 2021 share of those who reported they were worse off financially than a year ago. | |||||||
Inflation Was the Main Financial Challenge Mentioned
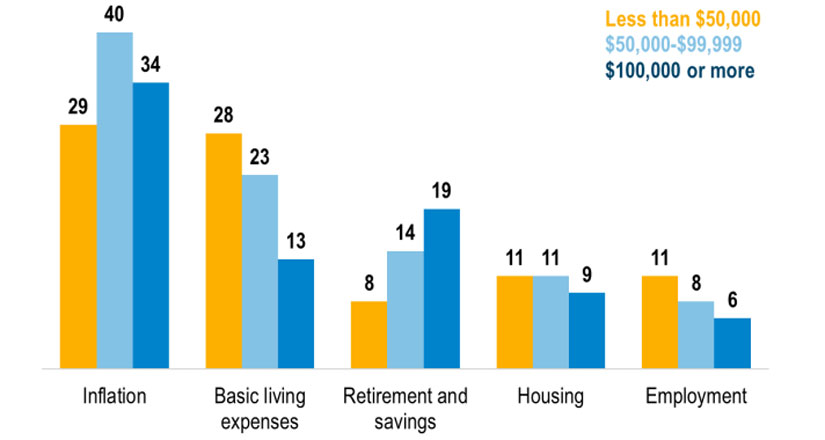
Asked an open-ended question about their main financial challenges or concerns in 2022, respondents most commonly cited inflation, with 33% mentioning words related to inflation or prices, followed by basic living expenses, with 22% mentioning words related to making ends meet, Merry said. (Note that 28% of respondents selected “none,” indicating that they had no main financial challenges/concerns.)
By income group, the overall results were the same for the lowest income (less than $50,000) and the middle income ($50,000-$99,999) groups, with inflation and basic living expenses the top two concerns mentioned. For the highest income ($100,000 or more) group, inflation was the top challenge mentioned, followed by retirement and savings. (See the column chart below.)
“Now, it’s a bit surprising that the lowest income group, the group in yellow, was somewhat less likely [than the other groups] to cite inflation as a challenge,” Merry said. “But in part this pattern of response may reflect how lower-income adults are talking about challenges.”
She noted that people with lower incomes may be frequently struggling with expenses, which may show up in the higher share mentioning basic living expenses as a financial challenge. In addition, they be more likely to be out of work, and thus more likely to cite employment as a challenge, she said.
Inflation Topped All Income Groups’ Lists of Main Financial Challenges
SOURCES: Federal Reserve Board’s Report on the Economic Well-Being of U.S. Households in 2022, released in May 2023. Graphic is from the presentation given during the July 13, 2023, Connecting Communities webinar.
NOTE: Values are percentages of the group that includes those who reported having no main financial challenges (“none”) and those who provided text responses to an open-ended question on the topic.
The Labor Market Remained Strong in 2022
Principal Economist Alicia Lloro discussed some results of the employment-related questions, including a question about job actions taken over the last 12 months.
“One important aspect of workers’ experiences in the labor market is the strength of the labor market that they’re facing,” she said, adding that some labor market indicators showed more strength in 2022.
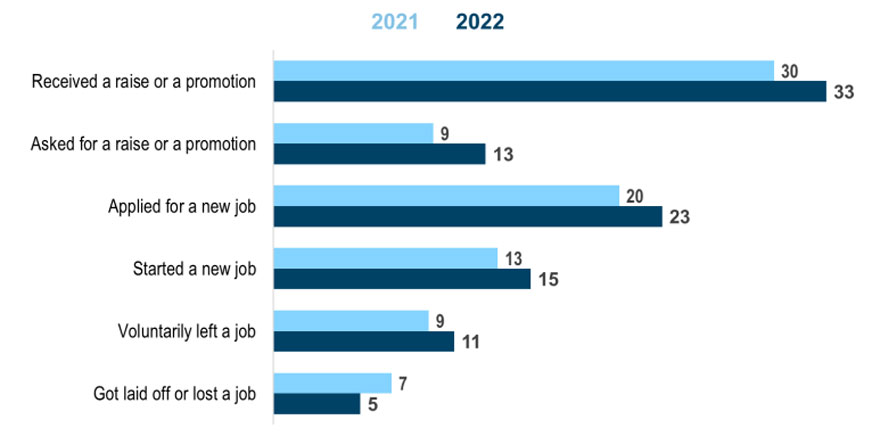
For instance, she noted increases in 2022 relative to 2021 in the share of adults who, in the prior 12 months:
- Received a raise or promotion
- Asked for a raise or promotion
- Applied for a new job
- Started a new job
- Voluntarily left a job
There was a slight decline in the share of adults who were laid off or lost a job in 2022 relative to 2021, as shown in the next chart.
Job Action Indicators Show Increased Labor Market Strength
SOURCES: Federal Reserve Board’s Report on the Economic Well-Being of U.S. Households in 2022, released in May 2023. Graphic is from the presentation given during the July 13, 2023, Connecting Communities webinar.
NOTES: Values are percentages and reflect job actions taken in the prior 12 months. Respondents could select multiple answers.
For more trends and analysis, see the full Report on the Economic Well-Being of U.S. Households in 2022 and interactive charts showing survey data.

This blog explains everyday economics and the Fed, while also spotlighting St. Louis Fed people and programs. Views expressed are not necessarily those of the St. Louis Fed or Federal Reserve System.
Email Us