


Sizing Up the Ranks of America’s Veterans
On the 11th hour of the 11th day of the 11th month of 1918, an armistice between Germany and the Allies took effect, which ended more than four years of conflict in “the war to end all wars.” The following year, President Woodrow Wilson proclaimed “Armistice Day” to commemorate the fallen in that war. By 1938, Armistice Day had become a federal holiday to honor veterans of the Great War.
Unfortunately, World War I didn’t end global conflict, and a new generation of Americans—a group later called the “Greatest Generation”—answered the nation’s call to service with the advent of World War II. In 1954, Armistice Day was changed to Veterans Day, broadening the event to include all of America’s veterans.
Every Nov. 11, communities across the U.S. hold speeches and parades to honor the military service and sacrifices of veterans. But exactly how many veterans are there? FRED, the St. Louis Fed’s signature economic database, can help answer this question, offering Current Population Survey (CPS) data from the Bureau of Labor Statistics.
The Veteran Population
The CPS defines a veteran as anyone who served on active duty (full time) in the U.S. armed forces; this includes personnel who were called up for active duty while serving in the National Guard or Reserves.
As of September 2023, there were an estimated 17.9 million veterans, who represent about 6.8% of the U.S. population age 18 and older. The FRED chart below shows the steady decline in veterans since 2000, as mortality continues to shrink the ranks of those who served in World War II, the Korean War and the Vietnam War and the overall size of the U.S. military declines.
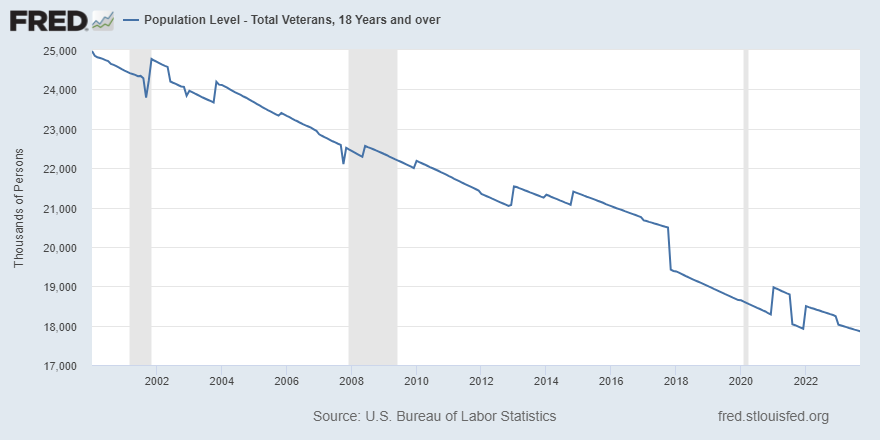
NOTES: The sharp decrease in November 2017 was due to a new baseline from a population model used by the U.S. Department of Veterans Affairs. In January, the monthly data is adjusted to reflect new U.S. population estimates. Display a FRED chart with quarterly averages or annual averages to view smoother trends.
Growing Presence of Women Veterans
Women have long played a key role in America’s military. But starting in the 1970s, the military began to break down many barriers that had kept many women out of the service, such as restrictions on the skills they could learn and a prohibition on entering military service academies like West Point.
The FRED chart below shows the breakdown of veterans by men and women. As of September 2023, there were an estimated 2 million women veterans, accounting for about 11.4% of all veterans. That was up from 1.6 million, or 6.2% of all veterans, in January 2000.
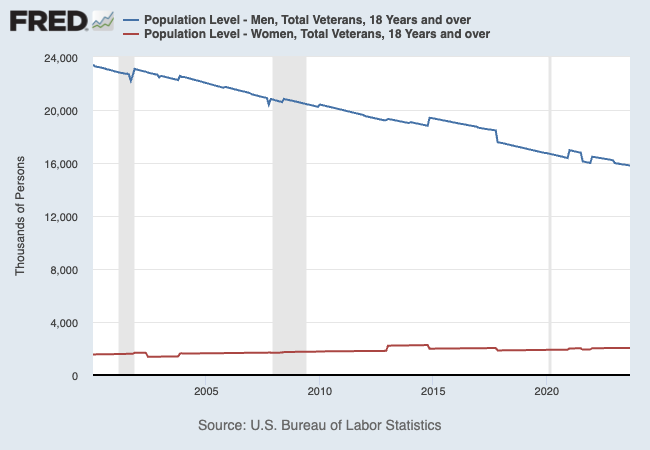
NOTES: The sharp decrease in November 2017 was due to a new baseline from a population model used by the U.S. Department of Veterans Affairs. In January, the monthly data are adjusted to reflect new U.S. population estimates. Display a FRED chart with quarterly averages or annual averages to view smoother trends.
Though FRED doesn’t have a monthly breakdown status of veterans by race or ethnicity, the Census Bureau releases these numbers annually in a veterans summary of their employment situation.
Veterans by Service Period
During which periods of major conflicts did many of the veterans serve? FRED also offers series from the BLS’ breakdown of key service periods:These veterans served during the conflict, though not necessarily in the conflict. For example, someone who served in the late 1960s may have been stationed in the U.S. or in Germany.
- World War II, Korean War and Vietnam War era. These veterans served sometime during December 1941 to December 1946; July 1950 to January 1955; or August 1964 to April 1975.
- Gulf War era I. These veterans served sometime during August 1990 to August 2001.
- Gulf War era II. These veterans served sometime during September 2001 to the present.
- Other. These veterans served outside of the previously mentioned eras.
As shown in the FRED chart below, the number of World War II, Korean War and Vietnam War veterans continues to fall as this elderly population steadily diminishes. Their numbers, which stood at 11.8 million in September 2008, were at 5.9 million as of September 2023. They currently represent about a third of all living veterans.
World War II, Korean War and Vietnam War veterans remain the largest group, though Gulf War era II veterans, at 5.1 million in September 2023, are approaching in size. As of September 2023, Gulf War era I veterans totaled 3 million, while veterans of other periods stood at 3.9 million.
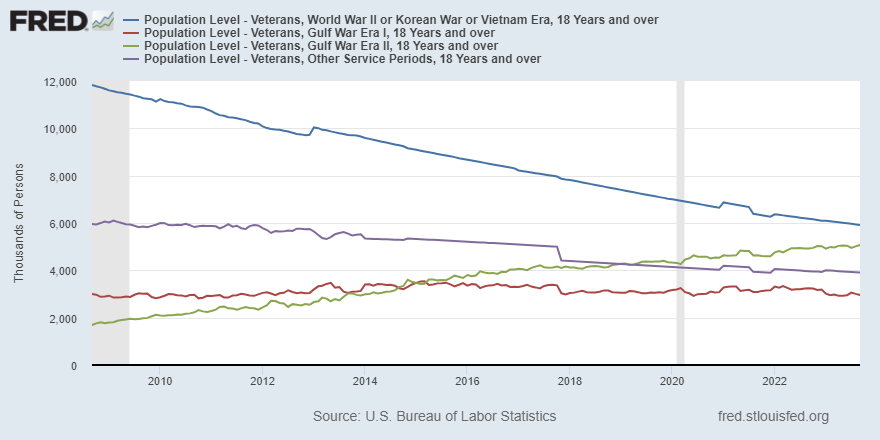
NOTES: Sharp decreases in November 2017 were due to a new baseline from a population model used by the U.S. Department of Veterans Affairs. In January, the monthly data are adjusted to reflect new U.S. population estimates. Display a FRED chart with quarterly averages or annual averages to view smoother trends.
For more data series on veterans, ranging from veterans’ unemployment rates to VA mortgage rates, visit FRED.
Note
- These veterans served during the conflict, though not necessarily in the conflict. For example, someone who served in the late 1960s may have been stationed in the U.S. or in Germany.

This blog explains everyday economics and the Fed, while also spotlighting St. Louis Fed people and programs. Views expressed are not necessarily those of the St. Louis Fed or Federal Reserve System.
Email Us